Overview
Description
[Notes] Renesas Emulator and Flash Memory Programmer Products with a USB Interface Notice Regarding Changes to Windows Driver Policy (PDF | English, 日本語)
As a sophisticated on-chip debugging emulator and flash programmer, the E20 emulator provides enhanced trace functions and RAM monitoring functions for RX600 and RX700 products, and the full basic debugging functionality equivalent to the E2 emulator Lite. It is capable of large-capacity tracing for enhanced debugging in combination with MCUs that incorporate trace output functionality.
![E20 emulator [R0E000200KCT00]](https://www.renesas.com/sites/default/files/e20.jpg "E20 emulator [R0E000200KCT00]")
Features
- Enhanced functions for faster debugging [Learn More :On-chip Debuggers Performance Property]
In addition to all the debugging functions of the E2 emulator Lite, the E20 supports powerful functionality such as larger trace capacity and realtime RAM monitoring. In addition, coverage function is supported on some MCUs of RX64M and RX71M Group.。 - Also functions as an on-board programmer.
Can be used as an on-board programming tool after the debugging, enabling smooth evaluation of the MCU. - Optimally suited for evaluating analogue functions such as A/D and D/A properties.
Electrical characteristics are the same as those of the actual MCU, since the actual MCU is used for debugging. - Serial, JTAG and LPD connections are supported.
For the communication system, serial, JTAG or LPD connection can be selected as required by the type of the target MCU. - Simple connection
Connection requires only a connector mounted on the user system, thus significantly reducing the possibility of loose connection. - Environmentally friendly material
The casing is made of plant-derived polylactide (PLA). - Learn More
Release Information
| Purpose of use | Software to be supported | Target devicesNote1 | Operating Environment |
|---|---|---|---|
| On-chip Debugging | CS+ *Evaluation Software Download | RX, RL78, RH850 [Details] Functions Supported by CS+ (XLSX) (XLSX | English, 日本語) | Operating Environment |
| e² studio *Download | RX [Details] Release notes | ||
| IAR Embedded WorkbenchNote2 | RX, RL78, RH850 | Contact IAR Systems. | |
| Green Hills MultiNote2 | RH850 | Contact Green Hills Software. | |
| Flash Programming | Renesas Flash Programmer V3 *Evaluation Software Download | RL78, RX, RH850 [Details] List of MCUs supported by Renesas Flash Programmer V3 (PDF | English, 日本語) | Operating Environment |
Notes:
1. For details when using devices of V850 family, 78K0R, 78K0, or R8C family, see E1/E20 software for V850, 78K0R, 78K0, or R8C MCU >>.
2. As for tools produced by partners, contact them directly.
FAQ
Target Devices
Target Family
- RX Family
- RL78 Family
- RH850 Family
Note: The E20 does not support RH850-family MCUs with the next-generation G4MH core, such as those of the RH850/E2x series. The E2 emulator is available for use with them. - V850 Family
- 78K Family
- R8C Family
Downloads
|
|
|
|
|---|---|---|
| Type | Title | Date |
| Upgrade - IDE | USB Driver for Renesas E-Series V1.01.00
|
|
| Software & Tools - Other | E1, E20 Self-Checking Program V.1.01.00
|
|
| Upgrade - Programmer | External Flash Definition Editor V.1.00 Release 01
|
|
|
3 items
|
||
Documentation
|
|
|
|
|---|---|---|
| Type | Title | Date |
| Manual - Development Tools | PDF 1.53 MB 日本語 | |
| Tool News - Notification |
PDF
121 KB
日本語
This is a tool news announcing the discontinuation of the E20 emulator. This document explains the final order acceptance date and the successor product. The final order is May 31, 2026.
|
|
| Manual - Development Tools |
PDF
230 KB
日本語
This is a feature list summarizing the capabilities of Renesas' on-chip debuggers for each microcontroller. For the E2 Emulator, E2 Emulator Lite, E1 Emulator, E20 Emulator, MINICUBE2, E10A-USB, and E8a on-chip debuggers, it details the debugging capabilities supported for each corresponding microcontroller, including connection methods, break functions, trace functions, and more.
|
|
| Manual - Development Tools | PDF 985 KB 日本語 | |
| Tool News - Note | PDF 209 KB 日本語 | |
| Application Note |
PDF
1.87 MB
日本語
AI-generated Summary:
This document explains how to port projects from CS+ to e2 studio for the Renesas RX family using emulators such as E2 Lite, E2, and E20. It details the differences in emulator settings, connection configurations, and debugging operations within e2 studio. Users learn how to open CS+ projects in e2 studio, configure emulator connections via the Debug Configurations window, and manage target devices. The document covers debugging features including breakpoints, tracing, memory and register manipulation, and performance measurements, facilitating smooth migration and effective debugging in the e2 studio environment.
|
|
| Tool News - Featured Tool | PDF 864 KB 日本語 | |
| Tool News - Notification | PDF 502 KB 日本語 | |
| Tool News - Note | PDF 183 KB 日本語 | |
| Tool News - Release | PDF 92 KB 日本語 | |
| Tool News - Release | PDF 83 KB 日本語 | |
| Application Note |
PDF
1.17 MB
日本語
AI-generated Summary:
Debugging methods focus on devices with an initially stopped CPU core and those transitioning to standby modes to optimize power consumption. Key capabilities include verifying core activation, measuring execution times for core activation and standby transitions, and restarting debugging at critical points such as core activation or MCU wake-up. Supported devices include various RH850 series MCUs. The document details environment setup, debugging configurations in CS+ and MULTI IDEs, and specific debugging techniques for different standby modes. It also covers precautions and terminology related to debugging and device operation.
|
|
| Tool News - Note | PDF 243 KB 日本語 | |
| Tool News - Note | PDF 150 KB 日本語 | |
| Tool News - Note | PDF 147 KB 日本語 | |
| Tool News - Note | PDF 159 KB 日本語 | |
| Tool News - Note | PDF 92 KB 日本語 | |
| Tool News - Note | PDF 127 KB 日本語 | |
| Manual - Development Tools | PDF 340 KB 日本語 | |
| Manual - Development Tools | PDF 954 KB | |
| Manual - Development Tools | PDF 1.12 MB | |
| Manual - Development Tools | PDF 1.07 MB | |
| Manual - Development Tools | PDF 821 KB | |
| Tool News - Note | PDF 168 KB 日本語 | |
| Manual - Development Tools | PDF 292 KB 日本語 | |
| Manual - Development Tools | PDF 282 KB 日本語 | |
| Manual - Development Tools | PDF 279 KB 日本語 | |
| Manual - Development Tools | PDF 337 KB 日本語 | |
| Manual - Development Tools | PDF 303 KB 日本語 | |
| Manual - Development Tools | PDF 318 KB 日本語 | |
| Manual - Development Tools | PDF 331 KB 日本語 | |
| Manual - Development Tools | PDF 683 KB 日本語 | |
| Manual - Development Tools | PDF 1.73 MB 日本語 | |
| Manual - Development Tools | PDF 420 KB 日本語 | |
| Manual - Development Tools | PDF 412 KB 日本語 | |
| Manual - Development Tools | PDF 423 KB 日本語 | |
| Guide | PDF 3.29 MB 日本語 | |
| Guide | PDF 3.36 MB 日本語 | |
| Application Note |
PDF
573 KB
日本語
AI-generated Summary:
The guide addresses common startup issues with the E1/E20 On-Chip Debugging Emulator. It explains warning messages about project file restoration due to version mismatches in CubeSuite+ and advises upgrading to the latest version. It highlights errors caused by missing CC-RX compiler installations and instructs users to install the compiler. The guide also details handling version differences in the CC-RX compiler, allowing debugging to continue if compatible or requiring version adjustments via the property panel.
|
|
| Manual - Development Tools | PDF 280 KB 日本語 | |
| Manual - Development Tools | PDF 269 KB 日本語 | |
| Manual - Development Tools | PDF 306 KB 日本語 | |
| Manual - Development Tools | PDF 2.54 MB 日本語 | |
| Guide | PDF 2.00 MB 日本語 | |
| Application Note |
PDF
415 KB
日本語
AI-generated Summary:
This guide addresses common startup issues with the E1/E20 On-Chip Debugging Emulator. It explains warning messages such as missing or incompatible toolchains, absent target device drivers, unrecognized emulator serial numbers, and device ID mismatches. Solutions include installing the correct compiler and software, verifying USB connections and power, refreshing device lists, and selecting the correct MCU device in settings to ensure proper debugger operation.
|
|
| Manual - Development Tools | PDF 178 KB 日本語 | |
| Manual - Development Tools | PDF 298 KB 日本語 | |
| Manual - Development Tools | PDF 298 KB 日本語 | |
| Manual - Development Tools | PDF 153 KB 日本語 | |
| Application Note |
PDF
525 KB
日本語
AI-generated Summary:
The External Flash Definition Editor (EFE) enables creation of custom write programs for flash memory devices with unsupported command sets. Users customize sample C source programs, link header and library files, then create RFD and USD files for use with emulator software. The custom program must not exceed 8,192 bytes in memory size and 256 bytes in stack size. The development environment requires specific sample files, a suitable C/C++ compiler, and emulator tools.
|
|
| Manual - Development Tools | PDF 140 KB 日本語 | |
| Manual - Development Tools | PDF 136 KB 日本語 | |
| Tool News - Release | PDF 309 KB | |
|
53 items
|
||
Additional Details
Specifications
Note that some functions shown here may not be supported under the IDE you use. Performance property and Connection system also vary depending on the MCU type. The specific features of the E20 emulator such as the large trace function and the real-time RAM monitoring function are available only when using with MCUs of the RX600 or RX700 series. When using with MCUs of other than the RX600 or RX700 series, the supported functions for debugging correspond to those of the E2 emulator Lite.
Important : On the use of specific features of the E20 emulator
The signals used for the large trace and real-time RAM monitoring functions of the E20 emulator are multiplexed with those for other peripheral functions. Whether the large trace and real-time RAM monitoring functions of the E20 emulator are available depends on the MCU, package, and peripheral functions that you will be using.
We recommend that you read the user’s manual for the MCU you are using and check if there is any conflict of functions on the trace pins.
You can use the Smart Configurator to make pin settings through a GUI and check for conflicts between multiplexed functions.
If the MCU you are using is supported by a debug MCU board and you use the board, all of the MCU pins are available for use by the user system.
| Item | Description |
|---|---|
| See On-Chip Debugger Functional Overview (PDF | English, 日本語). |
| On-board programming | Supported |
| User interface | 38-way cable [2-5767004-2 (product of Tyco Electronics Corporation)] 14-way cable Note1 [7614-6002 (product of 3M Co., Ltd.) and 2514-6002 (product of 3M Limited)] |
| PC Interface | USB 2.0, full speed and high speed |
| Target board connection | Via attached user I/F cable (Connection signals vary by the target MCU type.) |
| User's resource possession | Some MCUs possess the port peripheral functions. |
| Power supply | Not supported |
| Power voltage | 1.8V to 5.5V (depending on the target MCU) |
| External dimension (Except the protruding parts) | 114.9 mm×74.2 mm×19.2 mm |
| Conformance with overseas standards | European Standards: EN 55022 Class A, EN 55024 US FCC Standard: FCC part 15 Class A |
Note:
- The available debugging function corresponds to that of E2 Emulator Lite. Even when using with E20, the large trace function and Real-time RAM monitoring, specific functions of E20, are not supported.
Components
- E20 Emulator main unit
- USB cable
- User's system I/F cable
- 38-pin/14-pin converter adapter [R0E000200CKA00] *Available for purchase in single unit.
- Software CD-ROM
- Installation guide
- Self-Checking Program
- USB driver
- E1/E20 Emulator User's Manual
System Configuration
Refer to Release Information in this page for the information of the software on PC
Optional Products
Following optional products are provided to facilitate the use of the E20 emulators. Please make sure to choose the products that match MCUs you use.
Conversion Adapter
Converts the number and pitch of the pins in the connector for the connection with the emulator.
| MCUs | ||||||
|---|---|---|---|---|---|---|
| RX | RL78 | RH850 | V850 | 78K | R8C | |
| 38-Pin Conversion Adapter for the E1 Emulator QB-F14T38V850-01 QB-F14T38V850-01 ユーザーズ・マニュアル (E1エミュレータ用14ピン/38ピン変換アダプタ) / QB-F14T38V850-01 User's Manual (14-Pin to 38-Pin Conversion Adapter for E1 Emulator) (PDF) An adapter for changing to a 14-pin user interface for connection to a Mictor connector mounted on a V850-based target system | — | — | — | lens | — | — |
| 38-Pin to 14-Pin Conversion Adapter for the E20 Emulator (Bundled with the E20 Emulator) R0E000200CKA00 R0E000200CKA00 User's Manual (38-Pin to 14-Pin Conversion Adapter for E20 Emulator) Rev.1.00 (PDF | English, 日本語) An adapter for converting the 14-pin/2.54-mm pitch connector on the head of the emulator user interface cable to a 14-pin/1.27-mm pitch connector | lens | lens | lens | lens | lens | lens |
lens Available | — Not Available
Isolator
Enables debugging in an environment where there is a difference in potential between the user system GND and the host PC GND.
| MCUs | ||||||
|---|---|---|---|---|---|---|
| RX | RL78 | RH850 | V850 | 78K | R8C | |
| Isolator for the E20 Emulator R0E000200ACB10 R0E000200ACB10 User's Manual (Isolator for E20 Emulator) Rev.2.00 (PDF | English, 日本語) (For the RX family) | lens Note1 | — | — | — | — | — |
lens Available | — Not Available
Note:
- The isolator is not usable in combination with the debug MCU board for the RX71M group.
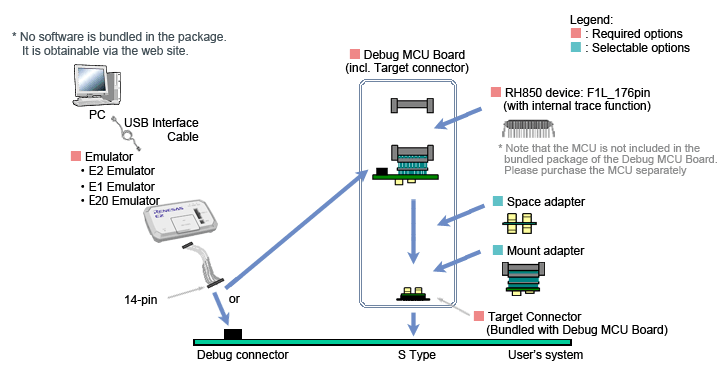
Debug MCU Board
Enables the in-circuit connection of the emulator with the user's system. This board allows you to use enhanced debugging functions. The applicable debugging function varies depending on the MCU type.
| MCUs | |
|---|---|
| RH850 | |
Debug MCU Board for RH850 Note: The package of the Debug MCU Board does not include the MCU. Please purchase it separately. For details, contact either a Renesas Electronics Corporation representative (responsible for sales) or distributor. | lens |
lens Available | — Not Available
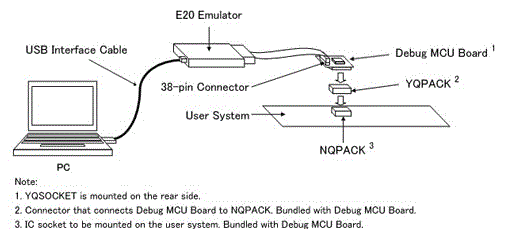
System configuration
| MCUs | |
|---|---|
| RX | |
| Debug MCU Board for RX Family Supported devices for Debug MCU Board for RX Family [On-chip Debugger] (PDF | English, 日本語) This board enables the use of all user port pins of the MCU in the user system. The E20 emulator occupies some of the pins for control of the emulator and the output of trace information, and these pins must be connected with a 38-pin connector attached to the E20 emulator on the user system. However, the Debug MCU board enables the use of all user port pins because connection with a 38-pin connector on the user system is not required. You can also obtain trace information even while using an MCU that does not have a trace function. | lens |
lens Available | — Not Available
System configuration
Design Support
Support
Knowledge Base
- E1202820 Error When Debug Tool is Started (CS+, E2, E1, E20) [RH850]
... to supply power to the user system: In the [Connect Settings] tab in the Property panel of the debug tool, set [Power target from the emulator] to [No]. If the power supply function of E1 emulator is used: Do not supply power to the user system from an external source ...
Mar 3, 2021 - Error (C0602202) occurs when I debug a RH850-family MCU. (CS+, E2, E1, E20) [RH850]
... of the debug tool. If you have forgotten the security ID (ID code), erase flash memory and set the security ID again. After flash memory has been erased, the security ID becomes all Fs ("FFFFFFFFFFFFFFFFFFFFFFFFFFFFFFFF" (32 digits)). Note: This answer also applies to the emulators listed in the applicable products.
Mar 4, 2021 - Error (E1203184) occurs when debug tool is connected. (CS+, E2, E1, E20) [RH850]
... disable the WDT or set the start mode. Therefore, if an internal reset triggered by the WDT is generated at connection of the E1 or E20 emulator, connection of the E1 or E20 emulator fails.If a tool cannot be connected after an option byte setting has been changed, it ...
Mar 4, 2021

Support Communities


