Overview
Description
CS+ supports the new device RX14T.
The CS+ integrated development environment provides simplicity, security, and ease of use in developing software. You can use the basic software tools for developing software for Renesas MCUs immediately after the initial installation. CS+ is also compatible with Renesas hardware tools including the debugging emulators (sold separately), which facilitates advanced debugging. Abundant extensions and functions for user support ensure a dependable environment for all users.
Compiler packages for the target products include CS+. Combining a compatible emulator product with CS+ makes all types of debugging functions available.
Features
- Python Scripts [Learn More]
Sample scripts are available on the Web site: You do not have to write scripts from scratch. - Smart Manual [Learn More]
Quick reference to register information from the editor (and other panels) without having to scan through manuals - Smart Browser [Learn More]
View the information you require, including the contents of hardware manuals and sample code - Comparing Performance in Optimization [Learn More]
Easy comparison of the results of optimization for speed, not only for size, and settings for this are quick and simple. - Interoperability with the Smart Configurator [Learn More]
Easy embedding of Renesas drivers in systems - Network Verification [Learn More]
[Debugging CAN bus reception procedures] No need for an actual other party when debugging communications - Online Help [Learn More]
Viewing the latest help files - CAN Communication Time Measurement Solution [Learn More]
[Measuring times for CAN bus reception] This allows you to measure the response times for CAN bus transfer (up to the start of processing by the program after reception). - Current Consumption Tuning Solution [Learn More]
[Measuring current drawn] You can check the relations between program operations and changes in current drawn by measuring system currents. - Verification Through Fault Injection [Learn More]
[Pseudo-error debugging] Abnormal states which are hard to realize can be set up with this system. - Verification of Safety [Learn More]
[Exclusive control check tool] Check variables in access-prohibited areas to see that they have not been changed. - Smart Reports [Learn More]
Collective output of quality-related information - Main-Core Debugging [Learn More]
Main-core debugging enables the development of user programs while keeping secure information confidential from engineers who are developing non-secure programs. - Learn More
Release Information
CS+
- Latest Ver.: V8.15.00
- Released: Jan 20, 2026
- CS+ for CC change history| CS+ for CA,CX change history | Previous Release Note
- License Information
- Operating Environment
- Supported Compilers
Important: CS+ is not generally promoted to U.S. and European customers.
| Product name | Supproted compiler | Download | |
|---|---|---|---|
| CS+(Note1) (Note2) | CS+ for CC V8.15.00 | CC-RL/CC-RX/CC-RH | CS+ for CC V8.15.00 |
| CS+ for CA,CX V4.09.00 | CA78K/CA78K0R/CA850/CX | CS+ for CA,CX V4.09.00 | |
Note
- There are two types of CS+, CS + for CC and CS + for CA,CX, and the supported compilers are different.
- If you hope to continue to use the product on the Windows 32-bit version, use the CS+ IDE V8.06 and earlier that supports the 32-bit versions.
[Notification] End of Support: CS+ Integrated Development Environment for Windows 32-Bit Versions (PDF | English, 日本語)
CS+ Information for Users
Regarding the component update, how to switch from the evaluation edition to the commercial edition, and how to upgrade the compilers, refer to [CS+ Information for Users] .
FAQ
Target Devices
Target Family
For details of the Target Devices, refer to Functions Supported by CS+ (XLSX) (XLSX | English, 日本語).
Design & Development
Videos & Training
This video demonstrates how to use Python commands to execute a sample script in the CS+ Python console.
Additional Details
Python Scripts
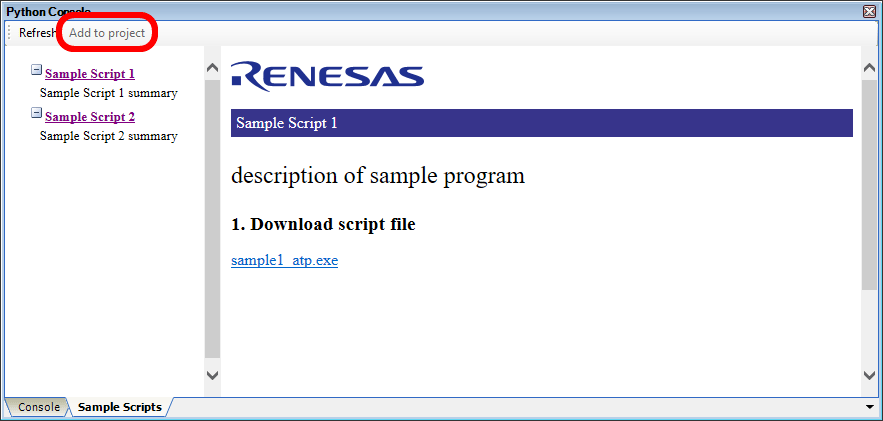
Sample scripts are available on the Web site: You do not have to write scripts from scratch.
You can obtain sample scripts that are executable with Python console from the Renesas Web site and simply register script files with projects and execute them (only for CS+ for CC).
- Check the sample scripts which are executable in a list.
- Register a script file with an active project by simply using the [Add to project] button.
- Double-click on the name of the script file you have acquired in the Project Tree panel to open the script file in an Editor panel. You can then customize the script file as you wish.
Smart Manual
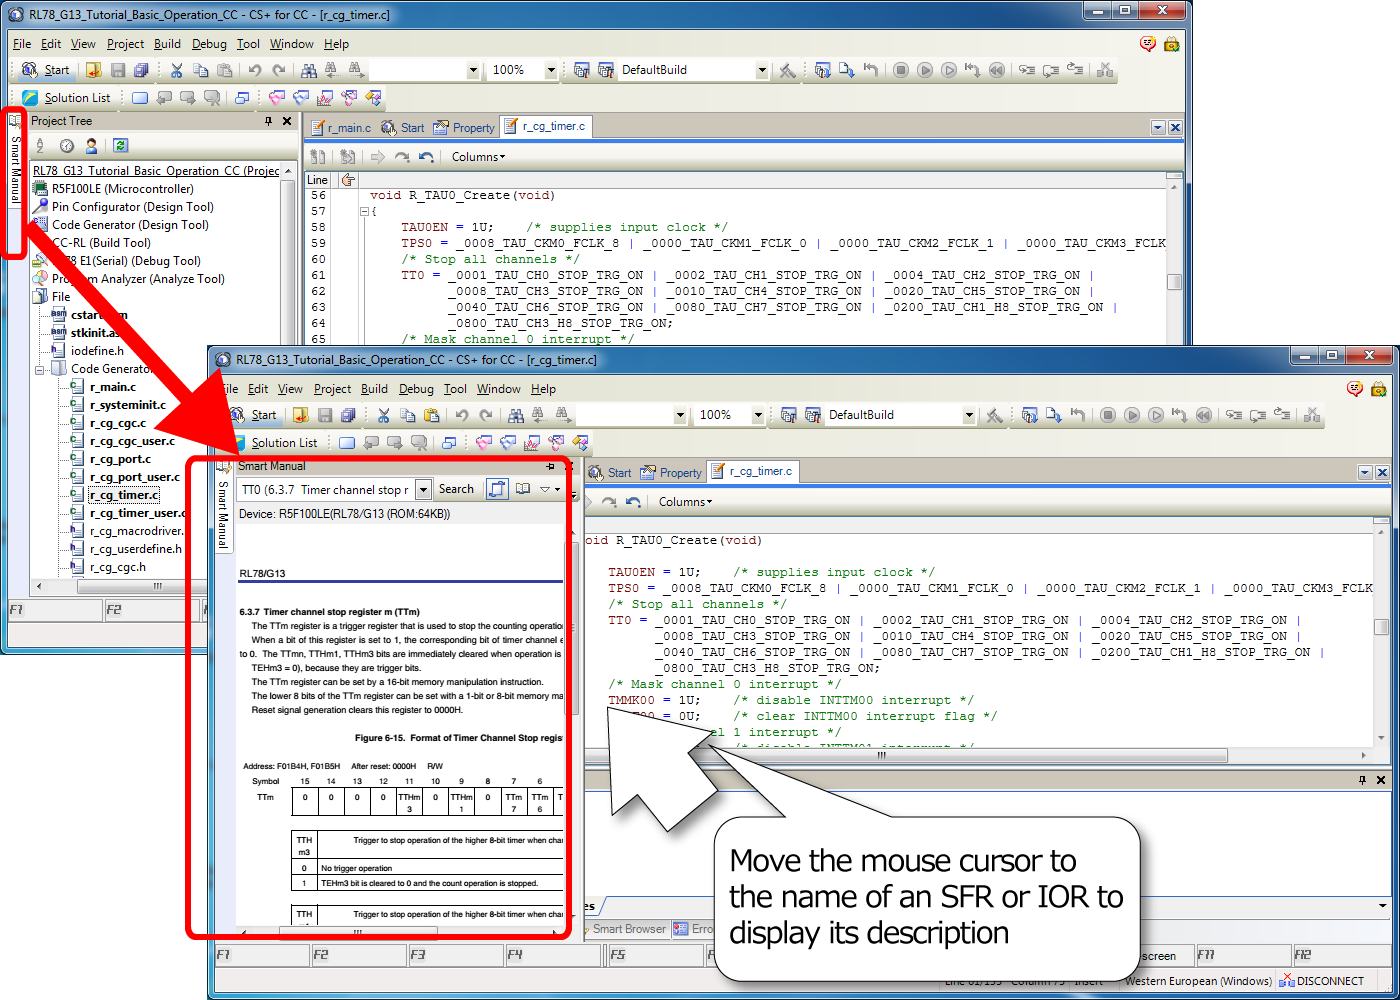
Quick reference to register information from the editor (and other panels) without having to scan through manuals
You can refer to the description of an SFR (special function register), IOR (input/output register), or API function generated by the Code Generator by simply hovering the mouse cursor over its name (only for CS+ for CC in projects for the RL78 or RX Family).
Supporting panels:
- Editor panel
- SFR and IOR panels (only descriptions of registers)
- Disassemble panel (only descriptions of registers)
You can also display a description of a desired register or specific pages of the hardware manuals from the [Smart Manual] panel.
Smart Browser
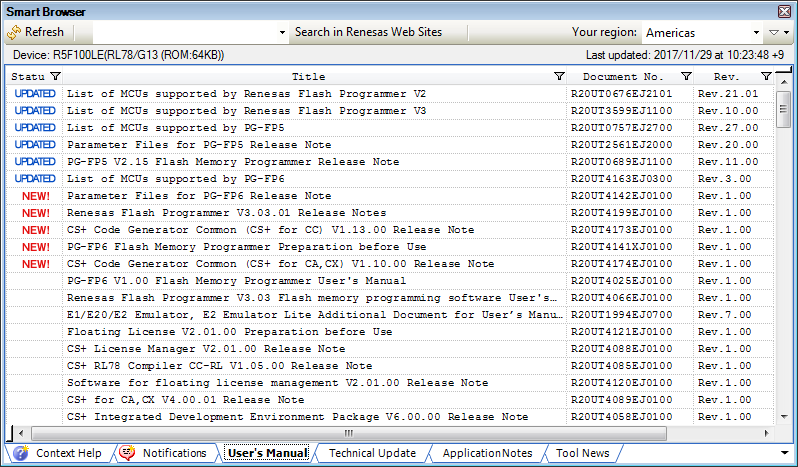
View the information you require, including the contents of hardware manuals and sample code
You can use this feature instead of a standard Web browser to easily view the contents of the latest information related to the device selected for the active project and to download sample code, if any, which comes with the applicable application notes. Note that this feature is only available with CS+ for CC.
- New releases and updated versions of documents are labeled “NEW” and “UPDATED”, respectively.
- The Smart Browser is capable of automatically searching for FAQs related to errors that have been displayed in the error dialog box and information posted on the Renesas Renesas Engineering Community Web site, helping you to solve problems as they arise.
Comparing Performance in Optimization
Easy comparison of the results of optimization for speed, not only for size, and settings for this are quick and simple.
The build options for optimization of the programs are applied automatically, and you can compare the results of optimization for code size or execution speed and set optimization accordingly (only for CS+ for CC).
- By simply clicking on a button, you can display code sizes and execution times for multiple patterns of build options.
- Since the results of measurement are shown in different colors, you can easily check the effects of settings for small code size or fast execution.
- A pattern of options can be selected and immediately reflected in a project.

Interoperability with the Smart Configurator
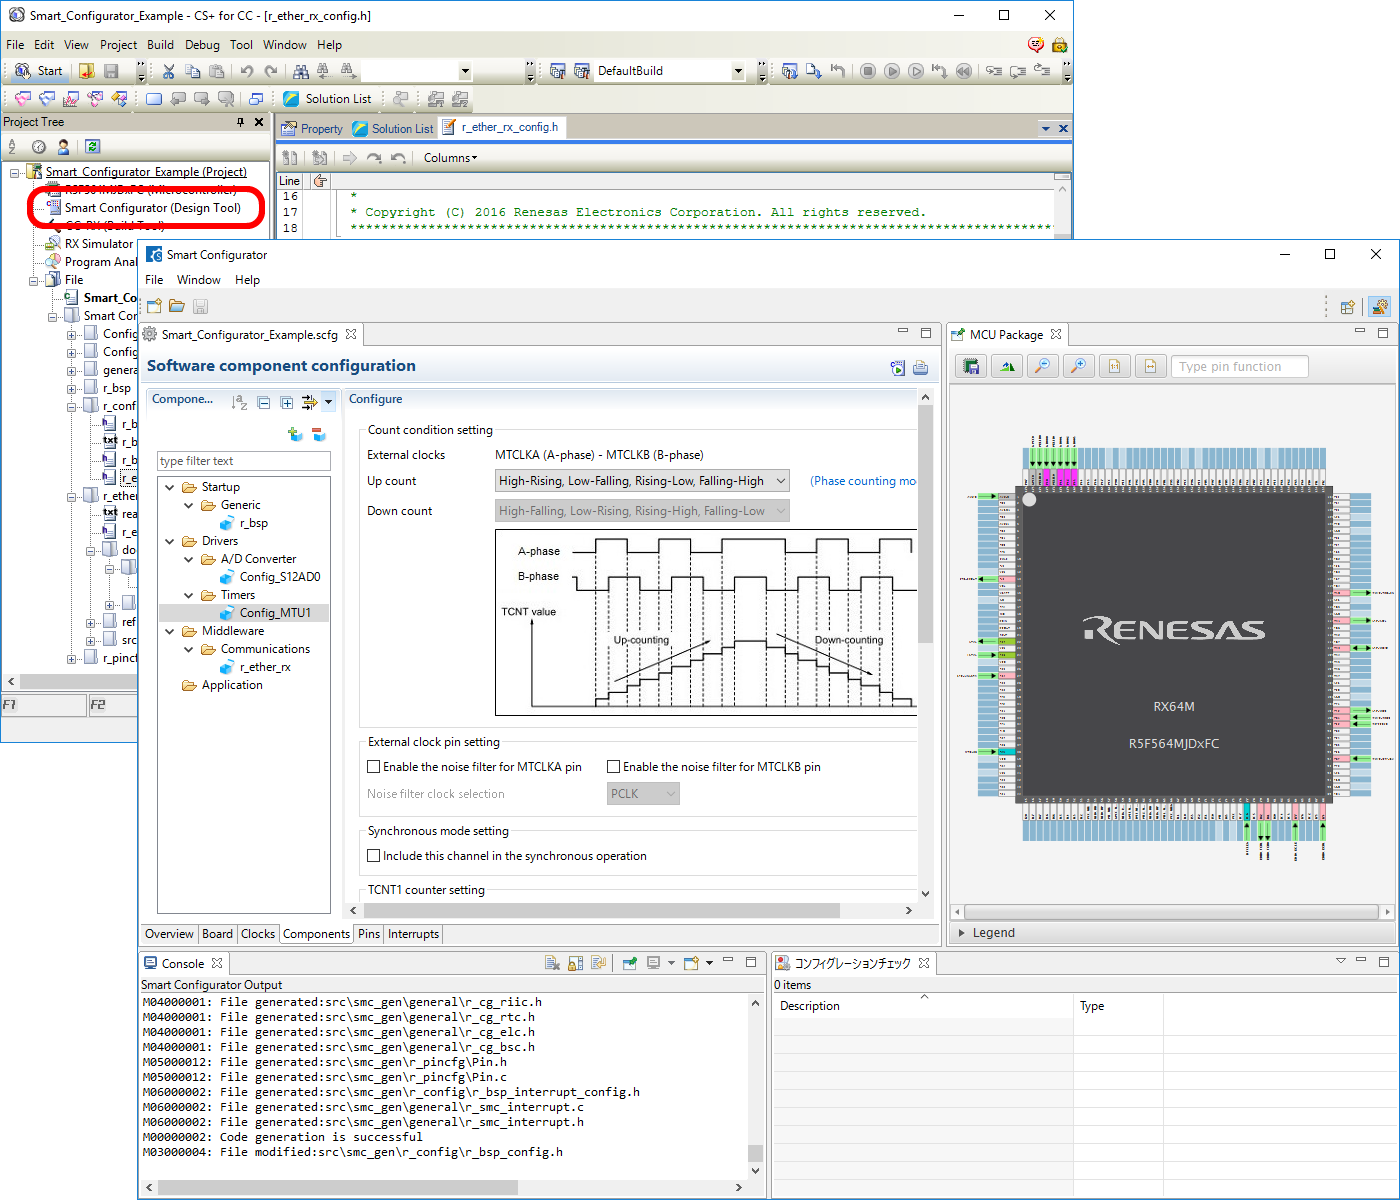
Easy embedding of Renesas drivers in systems
The Smart Configurator is a GUI-based tool with functions for setting up drivers for peripheral modules, middleware for embedding, and pin assignments. You can output optimal source code for Renesas MCUs or combine FIT modules with your own code (RX only). From V6.00.00, CS+ supports interoperability with the Smart Configurator for the RX Family.
- Activate the Smart Configurator from CS+.
- Add the files generated by the Smart Configurator to your CS+ project.
Network Verification
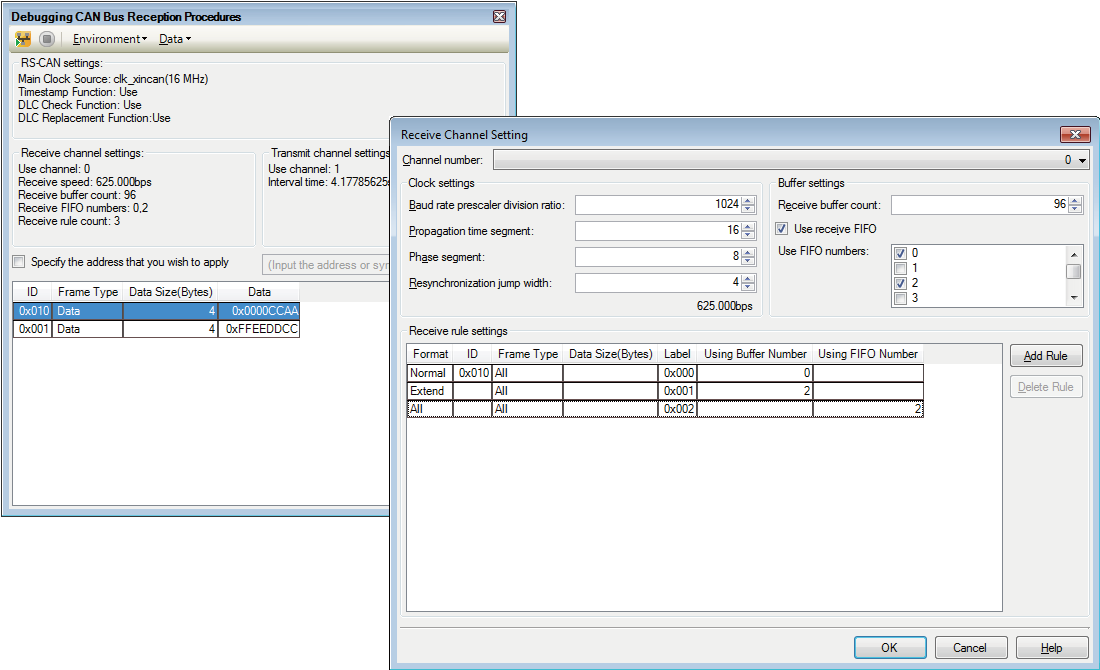
[Debugging CAN bus reception procedures] No need for an actual other party when debugging communications
The inter-channel communications facility of the RS-CAN module is applied to facilitate early stages in the debugging of network communications without an actual other party. A desired CAN channel or reception of a desired type of frame can be debugged in this way. The RS-CAN module of the device must, of course, have at least two channels if this is to be used (Only for RH850 family devices).
- Simply set the desired data and channel to make a program handle reception.
- Not only single frames but sequences of frames in a specified order can be transmitted.
- Creating test data is a smooth process since data for transmission can be imported and exported.
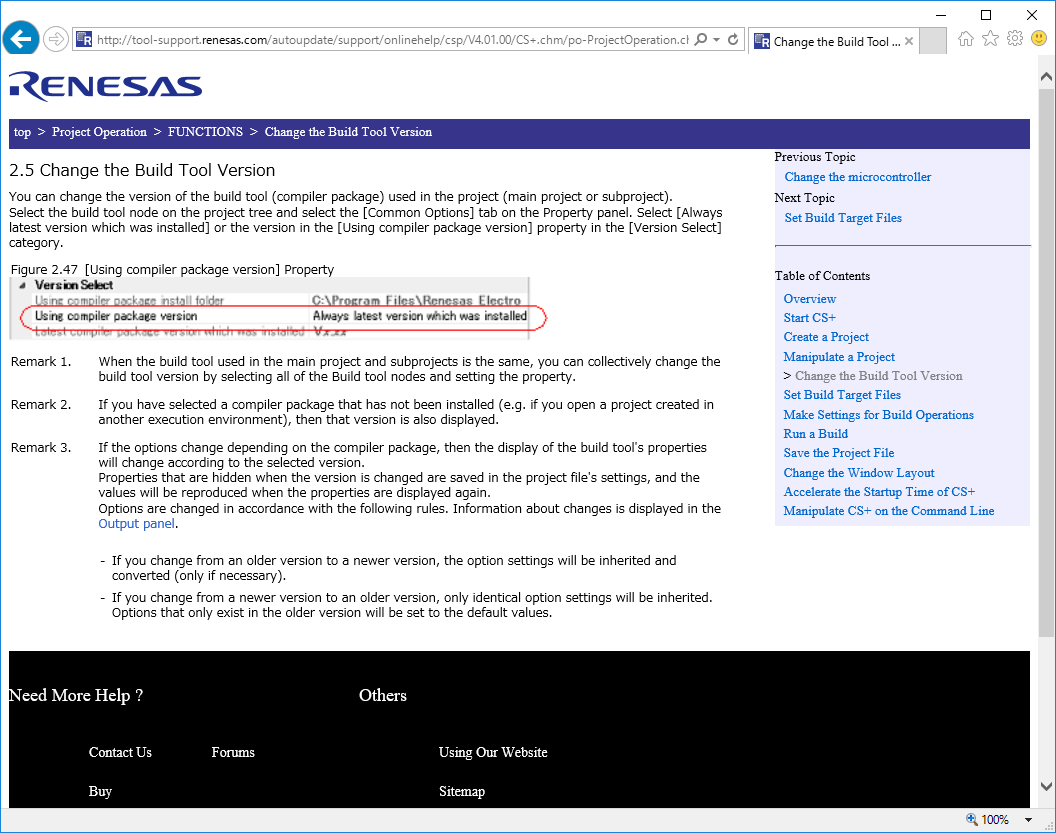
Online Help
Viewing the latest help files
You can view help information for CS+ online (only in CS+ for CC).
- You can thus view the latest versions of help files.
- You can consult help information from the Web in your customary Web browser and search for items in the browser.
- The existing function for viewing help files installed on the host PC is still in place.
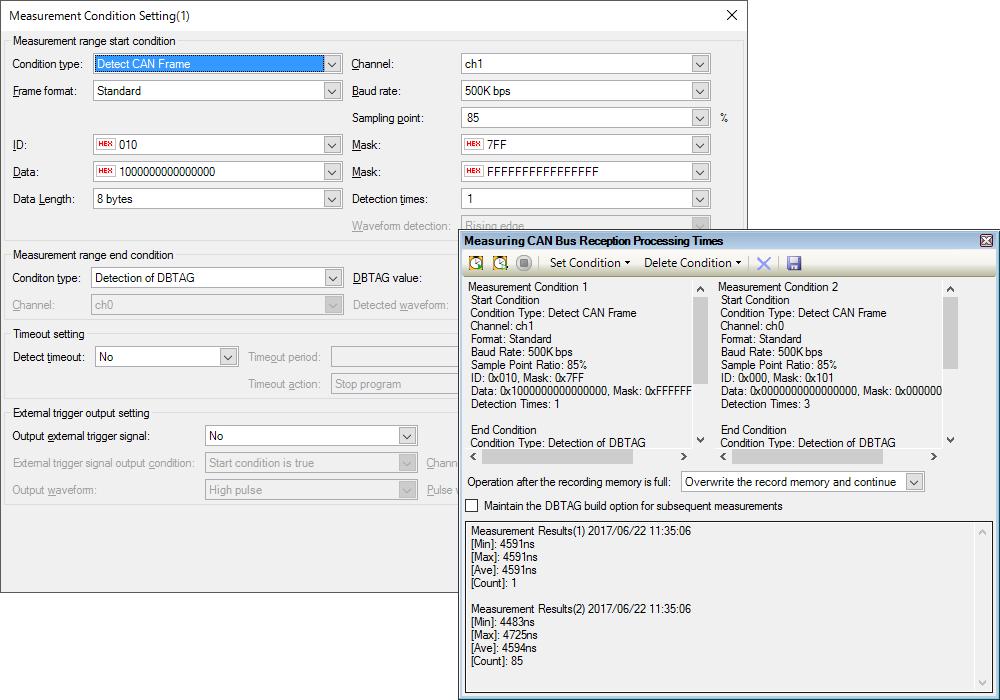
CAN Communication Time Measurement Solution
[Measuring times for CAN bus reception] This allows you to measure the response times for CAN bus transfer (up to the start of processing by the program after reception).
You can measure the CAN communications response times with the use of an E2 emulator, eliminating the need for an expensive CAN analyzer. This helps in the detection of problems at early stages (RH850 only).
- Response times are important in CAN communications. This facility makes measuring response times easy.
- A program can be made to stop when the response time is not within the allowable range.
- After stopping the program, you can check the trace data or the history of CAN communications.
Learn more about CAN Communication Time Measurement Solution >>
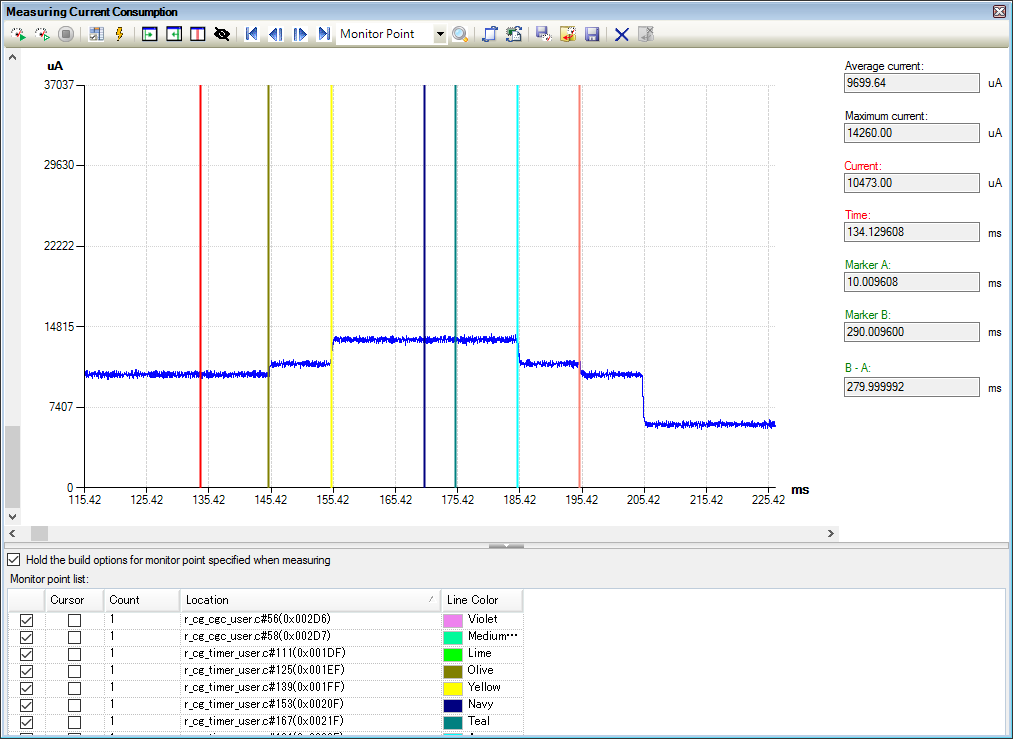
Current Consumption Tuning Solution
[Measuring current drawn] You can check the relations between program operations and changes in current drawn by measuring system currents.
The E2 emulator allows you to measure system currents without using an ammeter. This helps to shorten the times taken in operations for the tuning of current drawn (only for CS+ for CC in projects for the RL78 Family and RX100 and RX200 Series).
- Check the relations between system current and the operations of programs without having to modify your board or program.
- Simply specify the condition and the program will stop when excessive current is detected.
- You can also use monitoring points, in a similar manner to the setting of breakpoints, to monitor the relationship between the behavior of the program and values for current.
Use QE for Current Consumption to use these functions.
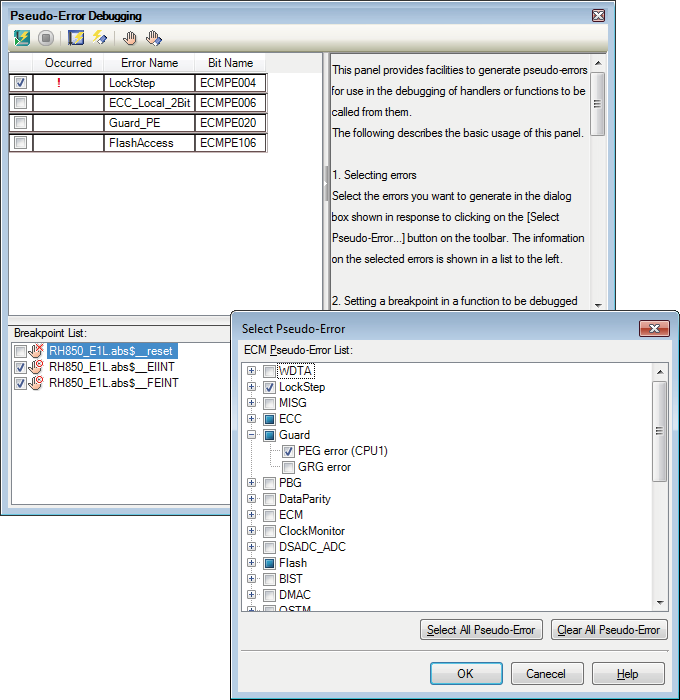
Verification Through Fault Injection
[Pseudo-error debugging] Abnormal states which are hard to realize can be set up with this system.
States which would be hard to set up on the actual system can be created by injecting artificial faults (pseudo-errors). This allows the effective debugging of program actions in response to detecting the corresponding abnormal condition. This facility is only available on RH850 Family MCUs equipped with the Error Control Module (ECM).
- Various pseudo-faults can be injected for MCUs, such as ECC errors and lock-step errors. Multiple pseudo-errors can be generated simultaneously.
- You can easily set breakpoints at and after the location pointed to by the interrupt vector for the error, and use these to debug program operation in response to the error.
- When various errors have occurred, you can check them in the [Pseudo-Error Debugging] panel.
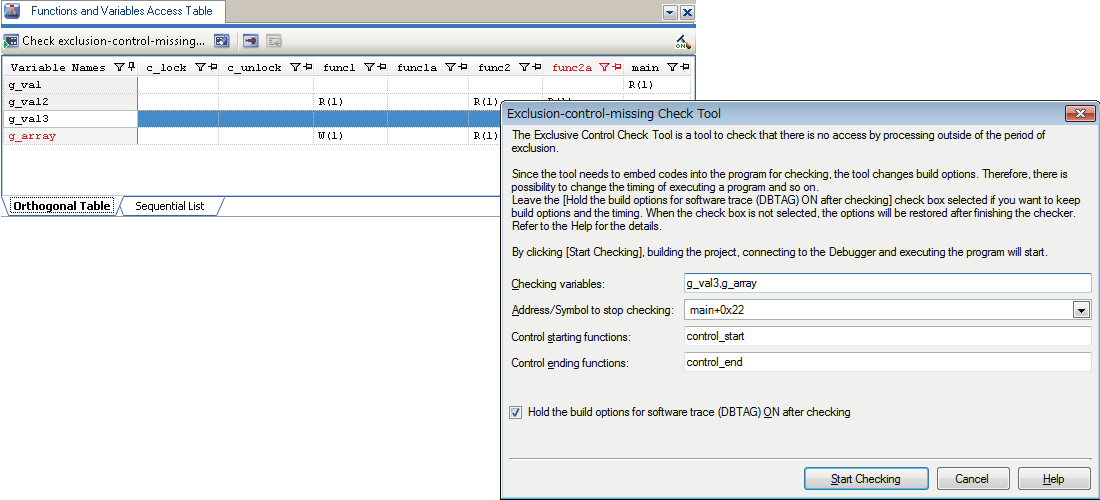
Verification of Safety
[Exclusive control check tool] Check variables in access-prohibited areas to see that they have not been changed.
You can easily detect if variables have not been changed in specific areas (e.g., in an area where interrupts are allowed). You can also use this feature to check for the correct application of exclusive control.
- Which functions access specified variables can be checked on a list of access (reading and writing). This is only for CS+ for CC.
- Overwriting of variables in specific areas (the spaces taken up by specified functions) can be detected and indicated as errors. Such errors can be debugged by jumping from the overwritten address to the corresponding line of source code. This is only for RH850 devices. (Note1)
Note
- This will also require V1.04.00 of the CC-RH C compiler for the RH850 family.
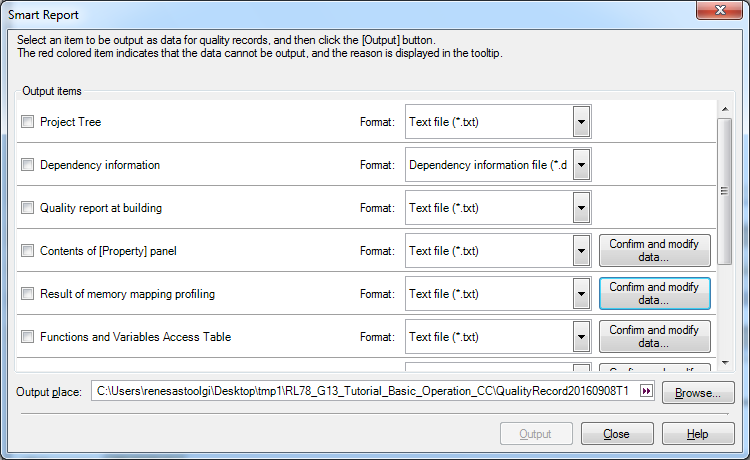
Smart Reports
Collective output of quality-related information
You can use this feature for the collective output of quality-related information such as listings of source files, build option settings, information on functions and variables, and coverage rates. Note that this feature is only available in CS+ for CC. CS+ supports the output of information on various items, which is useful in verifying the security of user-created programs.
[Types of information that can be output]
- Project trees, lists of dependencies, contents of the [Property] panel
- Quality reports on building
- Results of profiling of memory maps
- Lists of functions and variables, analysis charts, call graphs, and tables of access to functions and variables
- Build-tool information for compiler qualification service
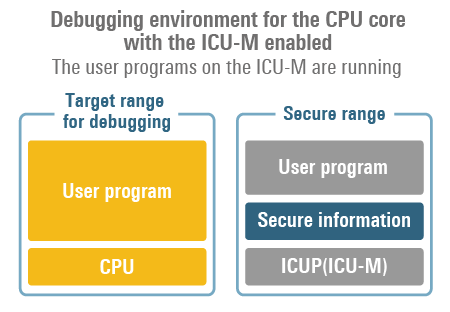
Main-Core Debugging
Main-core debugging enables the development of user programs while keeping secure information confidential from engineers who are developing non-secure programs.
Specifically, this allows the debugging of user programs on the main CPU core with the user program for the ICU-M running but without the person using the debugger being aware of its operations or the contents of the secure range (RH850 only).
Security-Conscious Debugging Methods for RH850 Devices (Main-Core Debugging) (PDF | English, 日本語)
Other Aspects of Simplicity, Security, and Ease of Use
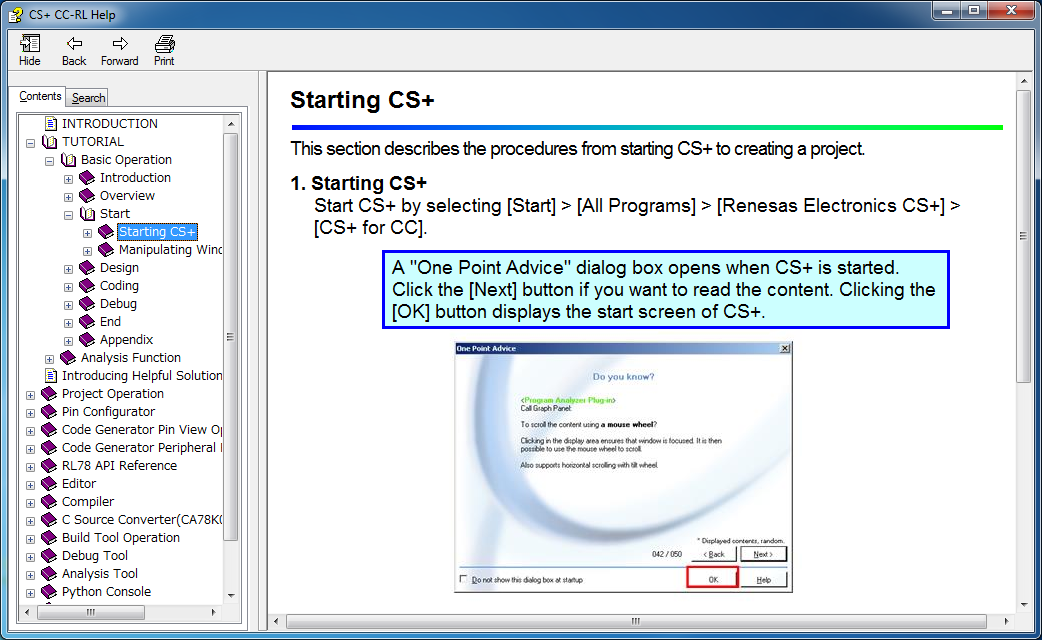
[Tutorials Make Things Easy]
Anyone can freely experience the CS+ IDE from the creation to the debugging of programs by going through the procedures given as tutorials.
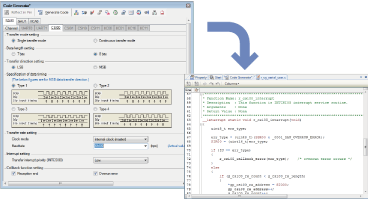
[Easy Code Generation (Note1)]
The control programs (device driver programs) to control MCU peripheral features (timers, UARTs, A/D convertors, and so on) can be automatically generated from GUI settings.
The APIs for code generation have common specifications for every family of MCUs. Once you have used this code generation feature in developing a program, the only thing you will need to do when changing to another MCU with the same internal peripheral functionality is to replace the device drivers. This dramatically reduces person-hours for development. Hence, developers can concentrate on learning the new peripheral features instead of spending time repeating work that’s already been done.
The generated program code is in the C language. From the GUI, even a beginner on an MCU can see at a glance why a given setting is made or what procedure is being performed.
Note
- This feature is not supported for certain MCUs.
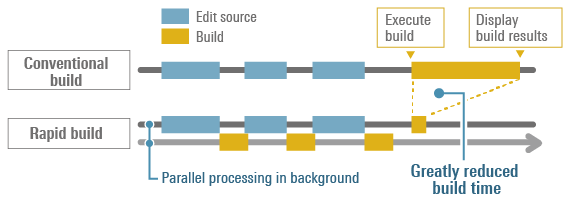
[Smooth Building]
In the conventional development environment, you had to execute all building after editing all of the source files. Building thus took a long time. The rapid building functionality of CS+, which automatically executes building from source files in the background every time they are modified or stored, dramatically reduces times taken for building.
[Smooth Debugging]
Furthermore, an “action event” feature is implemented for displaying the values of variables following execution of the program code at a given address.
The variable display feature can be specified by simply right-clicking on the mouse, so you can debug your code smoothly without spending time on extra build operations.
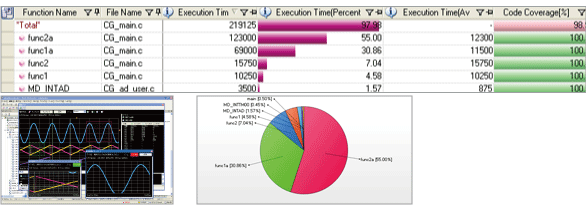
[Viewing and Finding]
The values of variables as the program is running can be displayed in an oscilloscope-like graphical form, so you can develop programs with an intuitive understanding of the analog changes which are essential to sensor applications and so on.
Also, identifying processes that impose heavy loads from the ratios of execution times of functions or from call graphs makes for efficient tuning of the performance of the system as a whole.
Analytical features such as sorted displays of functions or variables, output of CSV files, and the detection of definitions and declarations simplifies the management and maintenance of even relatively big and complex program structures.
[Backup Data]
The IDE has an efficient backup feature that can store and extract projects and tools in and from a file format.
Cooperating tools
[CS+ Supported Emulators]
The following emulators (sold separately) can be used with CS+ to debug programs.
- E2 emulator
- E2 emulator Lite
- E20 emulator
- E1 emulator (Discontinued product)
- MINICUBE (Discontinued product)
- MINICUBE2 (Discontinued product)
[Optional Debugger Extension Product]
QE for Battery Management is a plug-in for the CS+ IDE, enabling the adjustment of parameters required for the management of batteries.
QE for Battery Management (Battery Fuel Gauge)
CS+ Partner OS Aware Debugging Plug-in (download free of charge) can support task level debugging of real-time OS applications on CS+.
CS+ Partner OS Aware Debugging Plug-in
[Model-Based Development Environment]
We offer a co-simulation tool for interlinked operation of CS+ with MATLAB® and Simulink®.
Embedded Target for Renesas CS+ (Processor in the Loop Simulation (Note1) System): evaluation version
Note
- PILS means the simulation of the generated code on the target processor.
[Cycle-Accurate Simulator for RH850]
The cycle-accurate simulator on which times can be measured with accuracy close to those on the actual machine of RH850 is available as an optional product of CS+.
Supported Compilers
Support
Support Communities
- Can't compile FCL library on RH850 CS+ for CC IDE
When I'm including the FCL driver for the CS i get the following error (E) E0562330 E0562330:Relocation size overflow : "DefaultBuild\main.obj"-".text"-"00000169" RH850_TestCode_v_0_2.mtpj My guess is that I might not be mapping correctly the memory in the MCU Has somebody else ...
Sep 7, 2015 - When using MSPI, CS does not go high after SPI communication ends.
... waveform. It's normally high, but goes low when SPI communication starts.This is normal operation.However, even after sending data to the EEPROM, the receive interrupt is completed, and the channel is enabled, CS remains low.What control should I perform to set CS high after communication has ended?
Aug 19, 2025 - CS+ linker file error
Hi, When I am compiling the code , I am getting the below errors. I am new to this CS+ IDE. I think the below errors are due to not enough memory allocation for code. Could you please tell me what is the reason for below errors and also how to ...
Dec 28, 2021
Knowledge Base
- Is CS0 output even when built-in ROM is accessed?
CS0 becomes effective only when the CS0 space range is accessed. Because built-in Rom is not a CS0 space, CS0 is not output. Please refer to "Pin States" in the appendix of the hardware manual.
Mar 23, 2009 - Characters are garbled in CSV file read by Smart Configurator for RZ
The problem occurs because CSV files that can be output by the Smart Configurator for RZ V1.10 are coded in UTF-8.To display the file correctly, use the following procedure.1. Open the Memo Pad, and then drag the output CSV file to the Memo Pad.2. Make ...
Aug 2, 2017 - Memory Dump using CS+
... rather of the RFP, as the E1 also has a Debug connection mode you can use. So, instead of RFP, you can use our IDE (CS+) to access and upload the memory contents from the MCU to your computer via the E1. First install the latest version of CS+ at ...
Dec 6, 2023

Support Communities

