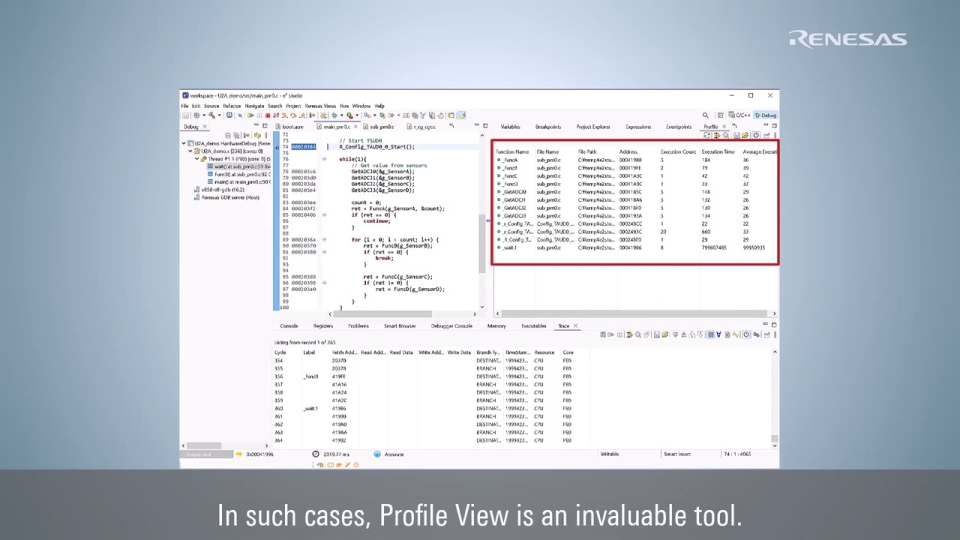
This video demonstrates how to use the Profile View in e² studio, which enables analysis of function-level execution counts and durations.
Related Resources