Overview
GR-ROSE is a small board for prototyping robot and IoT system. Enable simplified distributed processing for robot operation with open-source software like ROS2, Arduino and AWS FreeRTOS. The physical interfaces to attach serial servos, to supply voltage and to connect sensors make it easier to incorporate into robots. In addition, AWS FreeRTOS enables multi-task programming and easy connection to AWS IoT.
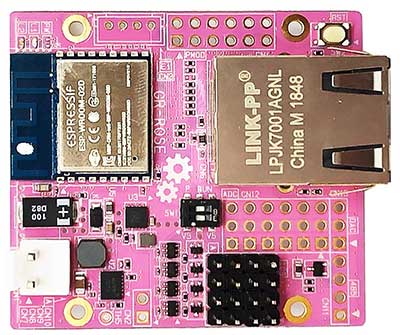
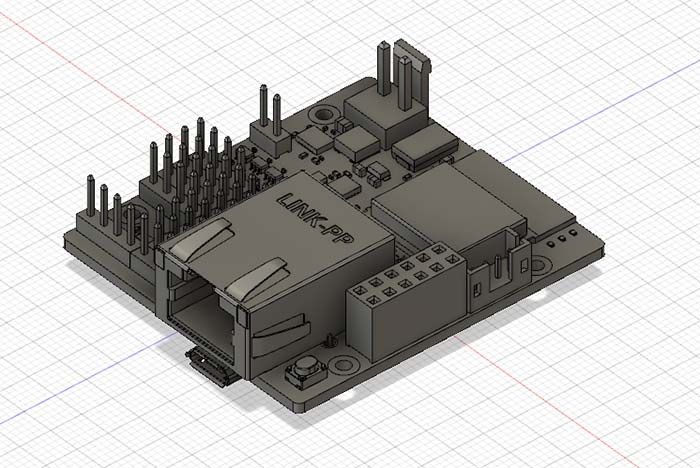
GR-ROSE Board
Equipped with the Renesas RX65N MCU, 5cm x 4.5cm, small and high density board incorporates Ethernet, wireless, serial servo, PMOD, analog and power supply
Certification
CE, EU RoHS, China RoHS
Certification of ESP32-WROOM-02D
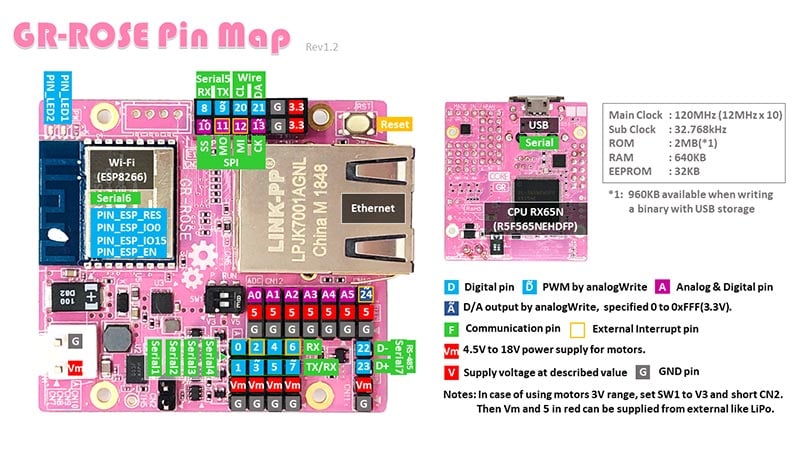
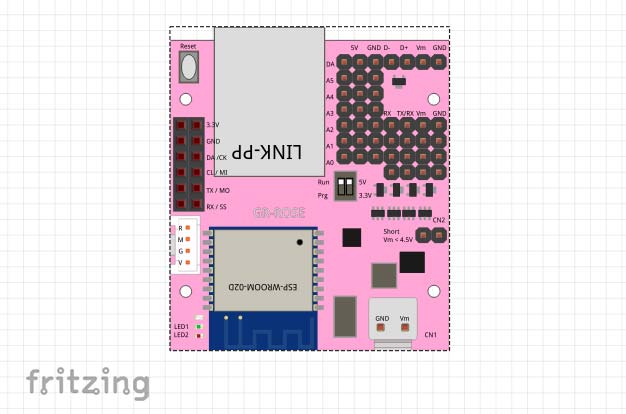
GR-ROSE Pin Map
Detailed Specification
Microcontroller
RX65N (R5F565NEHDFP 100-pin QFP)
RXv2 core [34 CoreMark/mA]ROM/RAM
2MB/640KB
Operating Frequency
120MHz (12MHz 10 Multiplication)
RTC Clock
32.768kHz
Sensors
Temperature (Inside MCU)
ROS I/F
Ethernet, USB (rosserial)
Serial Servo I/F
TTL x 4, RS-485 x 1
Analog I/F
ADC (12-bit) x 6, DAC x 1
Wireless
IEEE 802.11b/g/n
PMOD I/F
1 (I2C, SPI, UART)
External Power Supply
USB VBUS or 4.5V~18V
Supply to External
3.3V, 5V
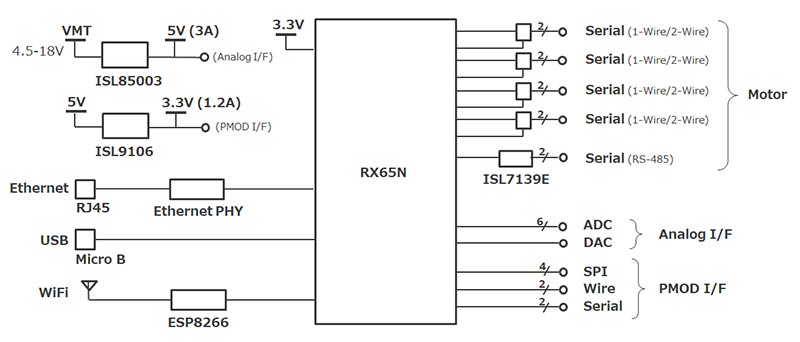
Block Diagram
Resources
Software Development Environment
Prepare an open-source software stack for an ROS2 application and three types of development environments.
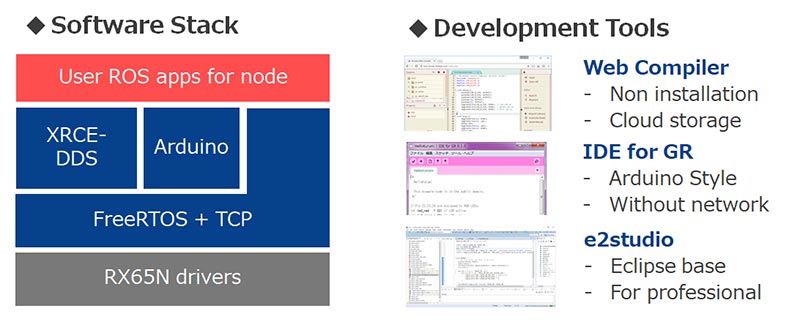
How to Program
- Arduino Sketch with Web Compiler
- Arduino Sketch with IDE for GR
- IDE for GR (off-line, like Arduino)
e2 studio (off-line, for professionals)
You can import as an archive file (zip) as existing workspace from e2 studio menu "File" -> "Import".
- GR-ROSE Sketch Source (GitHub)
- Using the Kondo Science Inc. “KXR-A3S” Robot Arm
- Connect a Debugger
Schematic/Design
- GR-ROSE Schematic (PDF)
- GR-ROSE Dimension (PDF)
- BOM
Sketch Reference
- GR-ROSE Sketch Reference
3D Data for Fusion 360
3D data that can be imported with Autodesk Fusion 360. Use it when making cases for GR-ROSE.
- GR-ROSE Autodesk Fusion (ZIP)
Fritzing Data
Data that can be imported by Fritzing. Wiring of a solder-less board can be done easily. (Designed by ksekimoto)
MicroPython
![]()
GR-ROSE can run MicroPython. (Published in GitHub by ksekimoto)
In order to run MicroPython, copy the bin file below to GR-ROSE after pushing the reset button.
Board Definition File for e2 studio (BDF)
This file can be used with e2 studio. It is useful when developing new GR-ROSE software.
GR-ROSE Board Definition File (ZIP)
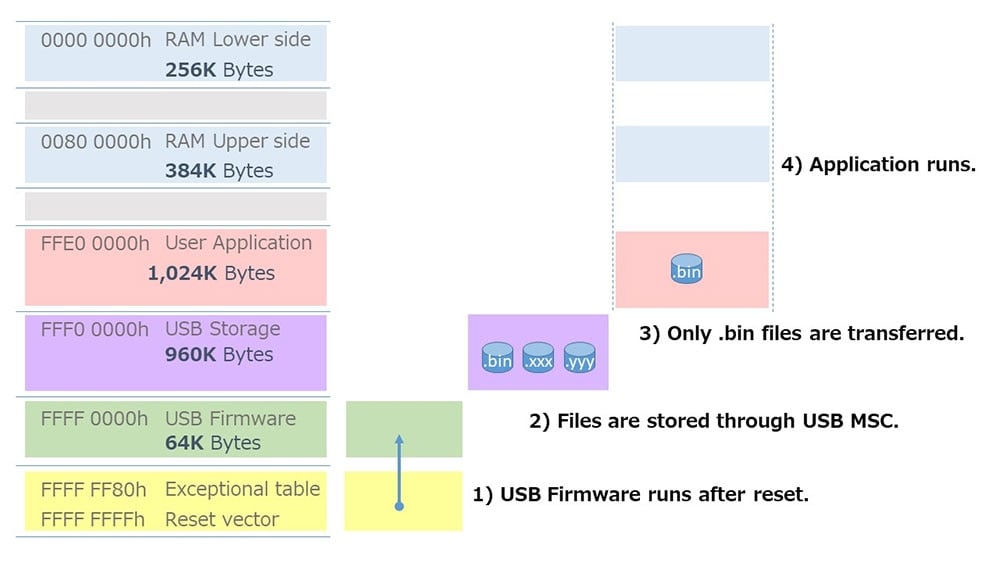
Factory USB Firmware
At shipment, USB firmware is written into the microcomputer. When you press the reset button, it becomes storage, and copying the bin file executes as user application.
USB Firmware
After setting SW1 of GR-ROSE to "P" and connecting USB, you can write the MOT file with Renesas Flash Programmer (RFP).
Notes: this firmware has been changed as follows from the firmware of the 1st shipment.
- CMT0 is stopped when jumping to the user application.
- If you press the reset button when power is supplied from VBUS or VMOT, jump to the user application if the USB port is not open.
The project file for e2 studio is below. CCRX is required to compile. Refer to the e2 studio product site for download and installation of e2 studio.
You can import as archive file (zip) as existing workspace from e2studio menu "File" -> "Import".
Note: This is a project exported in e2 studio version 7.2.
Technical Support
- E-mail: gadget_renesas@lm.renesas.com
GR-ROSE Board Distributors
GR-ROSE boards can be purchased through the following site:
Note: CE certification will be done at the end of June 2019.
- Chip One Stop
- Japanese Distributors
