Overview
Description
R-Car Multi-Core Synchronous Debug and Trace Tool
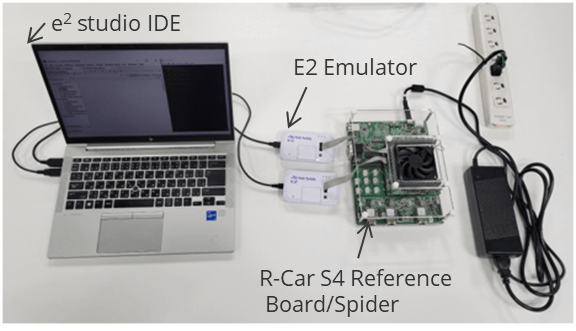
Learn about the new multi-core synchronous debugging support in the e2 studio integrated environment for R-Car S4. In-vehicle SoC devices contain multiple CPUs and IPs, and the software shares those resources. A lot of effort is required to analyze and solve the problem if a problem occurs in the operation during the software integration stage. To address this issue, Renesas has developed the “Multi-Core Debug and Trace Tool,” a tool that facilitates analysis and identification of the causes of problems resulting from the interaction of multiple hardware resources in R-Car.
Target Devices
Design & Development
Videos & Training
Challenges With Debugging During SOC Development
Automotive ECUs, especially those such as central ECUs with advanced processing, are equipped with multiple cores which work together in a single SOC. When you combine software running on multiple cores, it can be time-consuming to identify which software is causing the problem.
Examples of the issues when using traditional development tools are described below.
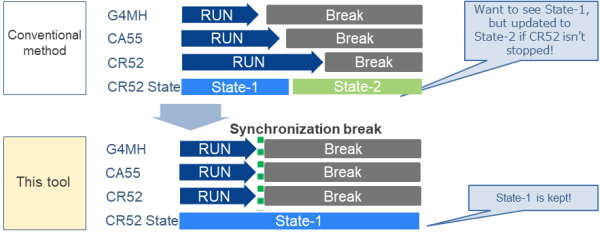
As seen in the figure on the right, it was previously a common practice to stop the operation of the G4MH cores and check the status of registers, memory, and variables using a debugger when something abnormal occurred in Software-A running on the leftmost G4MH core and you wanted to debug it. However, even if the G4MH core is stopped, the other cores would still be running, so if you attempt to see what was happening in Software-B or C when a problem occurs in Software-A, Software-B or C may have progressed further or, in some cases, may not be working at all. It may be that the behavior of Software-A is so strange, due to the fact that it is stopped, that we cannot get to the fundamental problem.
Features
- Use Case and Expected Benefits
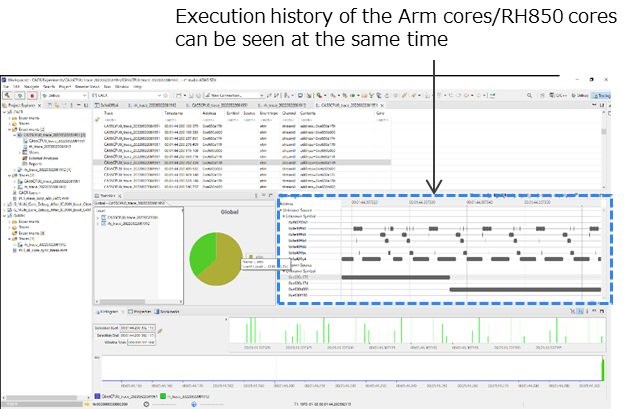
- The multiple heterogeneous processor cores (Arm cores (CR52, CA55) / RH850 cores (G4MH)) that are integrated in the R-Car S4 can be debugged and traced simultaneously. This reduces the time required to identify the causes of problems and to analyze them in systems where multiple cores work together to achieve functionality.

Main Functions
- Synchronous execution control
- Synchronization breaks make it easier to see unexpected behaviors and bug conditions.
Example: When you want to identify a problem event (CR52 State-1) by referring to the state of the S/W variables and I/O inside the SOC when the problem event occurs.
- Synchronous tracing
- Synchronously checking the flow of SW operations of each core simultaneously makes it easier to identify the conditions under which problems occur.

Support

Support Communities


