Overview
Description
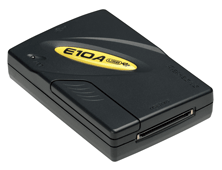
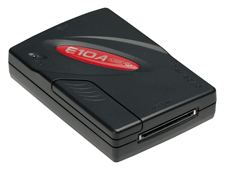
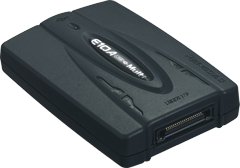
The E10A-USB emulator is an on-chip debugging emulator which supports the development for systems using microcomputers of the SuperH RISC engine family, the H8SX family, and the H8S family. As the main body of the E10A-USB emulator is connected to the user system via the dedicated debug interface (H-UDI and AUD), you can debug in such a form close to the completed product.
Features
- Breakpoints
- Hardware Breakpoints, dependent on device specification
- 255 software breakpoints
- User break
- Trace functions
- 4 branch trace messages stored on device H-UDI capable devices
- Real time branch trace with AUD capable devices -HS0005KCU02H only
- RAM monitor
- The contents of a memory can be referenced and changed during program execution in real-time with AUD capable devices.
- Full source level debug
- Support for Renesas , IAR and GNU compilers
- Host requirement
- PentiumR3 600MHz or greater
- RAM 128MB or greater
- Available hard-disk 50MB or greater
- USB rev 1.1 port
- User I/F
- 14-way connector (Type: 2514-6002: [3M Co., Ltd.])
- 36-way connector (Type: DX10M-36S: [Hirose Electric Co., Ltd.])
- Learn More
Release Information
Target Devices
Design & Development
Additional Details
Lineup
See the product pages for the details of each model below.
| Item | Description | ||
|---|---|---|---|
| Products | HS0005KCU01H for the H-UDI interface Note1 Image  | HS0005KCU02H for the AUD trace function Note2 Image  | HS0005KCU14H for the Multi-core MCUs of SuperH RISC engine Family Image  |
| MCUs |
| ・Multi-core MCUs of SuperH RISC engine Family | |
Notes
- The H-UDI (User Debugging Interface) is an interface compatible with the Joint Test Action Group (JTAG) specifications.
- The AUD (Advanced User Debugger) trace is the large-capacity trace function that is enabled when the AUD pins are connected to the emulator. When an event that starts trace acquisition occurs, the trace information is output in realtime from the AUD pins. For more details, refer to On-Chip Debugger Functional Overview (PDF | English, 日本語).
Support
Support Communities
- How do you disable watchdog on SH3 7706 via Workbench when debugging w/ E10a-USB
I could probably go in and tweak the register every session as it is memory mapped, but is there some setting in the Embedded Workbench to do that for all debugging sessions? I haven't been able to find it if there is. I'm using version 4.0.
Nov 21, 2019 - WTB: Used E10a-USB red or yellow programmed for SH3 7706 (H-UDI debugger)
This is probably a long shot that someone would have one of these, but the folks at Renesas support suggested I post an inquiry here. If this is not the correct forum to post this, I will remove and post there. thanks!
Sep 26, 2019 - Error while connecting the E10A- USB Emulator and SH72531 to PC
Hi, I am using SH72531 and I have an E10A USB emulator (HS0005KCU02H). I am following the process given in Renesas SuperH Family E10A-USB Emulator User’s Manual. But whenever I try to connect the SH72531 and E10A USB Emulator to the host (Desktop PC), I am getting the ...
Oct 11, 2017
Knowledge Base
- Detailed info about ID code usage in debugging w/ E10A-USB emulator
When starting up after selecting the E10A-USB emulator mode (E10A-USB emulator startup mode) When you select “input new ID code” in the [ID Code] dialog box (checked) The flash memory is completely erased at startup. After it is erased, enter the ID code you entered when writing the ...
Jun 10, 2011 - What is the cause if I use E10A USB and it will not run whether I select MCU?
H8SX/1651 Group:This message is displayed when the EMLE pin on the H8SX/1651 Group MCU is set to low. When using the E10A-USB, make sure the EMLE pin on the H8SX/1651 Group MCU is set to high. SH7080 Series, SH7146 Series, SH7149 Series ...
Apr 13, 2011 - Can I use E10A-USB emulator to read data in internal ROM?
When the E10A-USB emulator is connected in the [E10A-USB Emulator] mode, data can be read from the internal Flash ROM during debug, etc., if you do so after the ID code check. On the other hand, there is no read function in the E10A-USB emulator [Writing Flash ...
Jul 20, 2007

Support Communities

