
Evolution of E/E Architecture
With the evolution of “CASE”, E/E architecture has evolved from the conventional distributed network configuration to centralized and zone architecture, and functions are being integrated into individual ECUs and functions are becoming more sophisticated for “CASE” realization. As a result, each and every ECU contains multiple MCUs and SoCs, and the software executed on these devices is also becoming larger and more complex. While the software for ECUs is thus becoming larger, its development time is required to be shorter than before, as shown by the rapid expansion of the xEV market. By providing a development tool that enables not only multi-core but also multi-device debugging, Renesas strongly supports our customers in shortening ECU development time and reducing rework after the design phase.
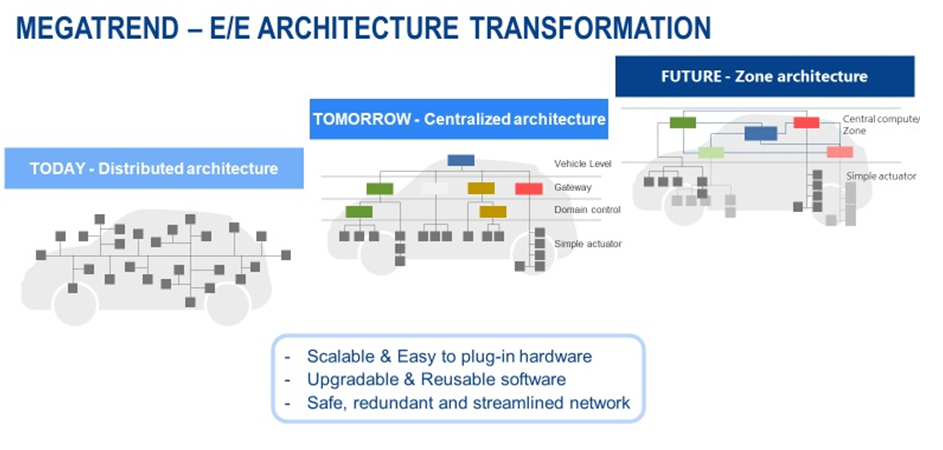
Figure 1. E/E Architecture Transformation
Multi-Device System Debugging
One ECU is increasingly equipped with multiple functions and configured with multiple devices. An example of Gateway ECU configuration is shown below (Figure 2).
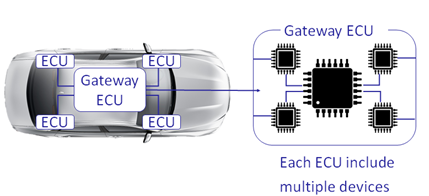
Figure 2. Gateway ECU
For software that shares data among multiple devices, such as Gateway ECU, there is a system configuration in which data generated by multiple software is stored in the shared memory of other devices.
Consider developing software that works together on those multiple devices. Assume that during testing a bad behavior is observed in which incorrect data is written to shared memory. To resolve this problem, as the 1st step, you need to identify which software on the device causes the problem.
If incorrect data is stored in Device B's shared memory, a common method of debugging is to stop Device B's operation and use the debugger to examine the register, memory, and variable values. However, even if Device B is stopped, Device-A continues to run. That means the variable values cannot be observed at the time the problem occurred, and the root cause cannot be traced (Figure 3).
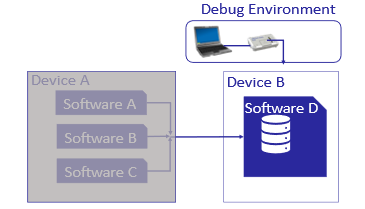
Figure 3. Debug Environment
Using the multi-device debug and trace tool released this time, it is possible to easily identify which software in Device-A is writing incorrect data by combining the data access history of synchronous break and trace (Figure 4).
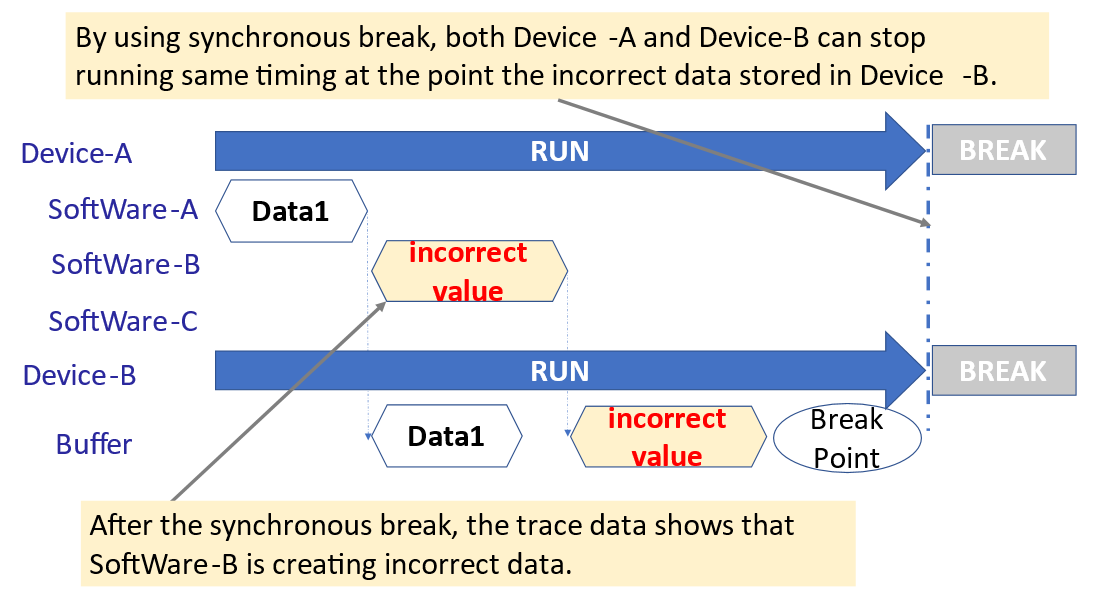
Figure 4. Multi-Device Debug and Trace
By debugging multiple devices synchronously, it is possible to check the software behavior of the entire system in which each device cooperates while sharing resources such as memory and network, and to identify the root cause and analyze the problem in a short time.
Please refer to the explanation and video demonstration of the synchronous debugging function introduced here.
Future Developments
Our ultimate goal is to provide a debugging tool set for the entire vehicle. We think this multi-device debug and trace tool is just the beginning for analyzing the behavior of software running in a complex and intertwined E/E architecture.
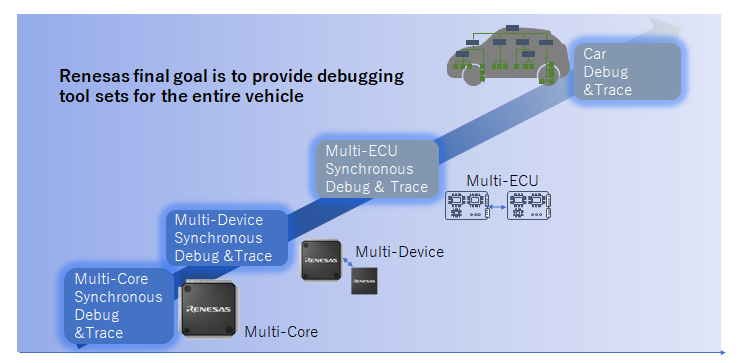
Figure 5. Renesas final goal is to provide debugging tool sets for the entire vehicle
We are considering two approaches to bring the multi-device debug and trace tool closer to our final goal. The first approach is to apply same time-line tracing of the RH850 core and Arm core in the R-Car S4, which has already been realized, and to consider tracing the same timeline on different cores and multiple devices. This will further enhance the multi-device synchronous debugging introduced here.
Another approach is to target not only debugging using ICE but also trace and log information from various tools. The concept is as shown in Figure 6, where the CPU trace information with time stamps, log information, performance analysis information, etc. output from each tool obtained from the target board is analyzed, and the trace information is displayed on the same timeline. We believe it would be useful for analyzing faulty events so that we continue to develop, and we would like to make the best use of the ecosystem of tools that can be connected to the system to minimize the investment cost for our customers.
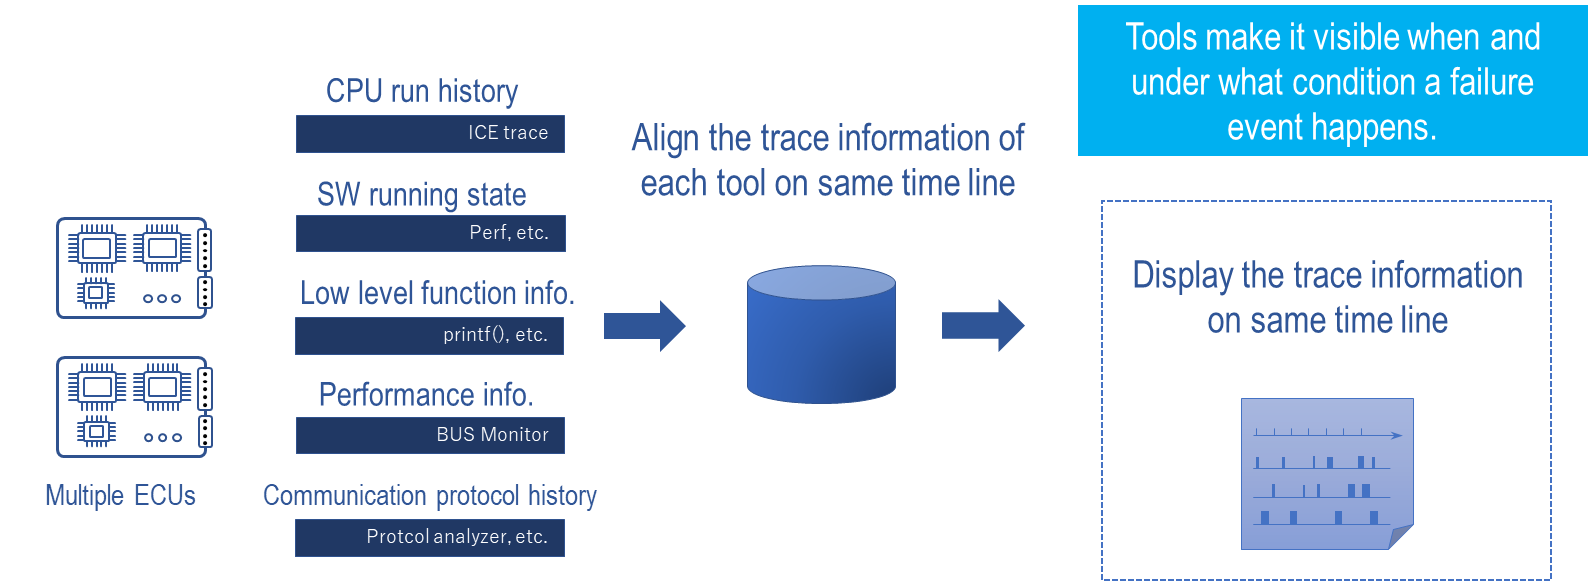
Figure 6. Debugging Concept
Furthermore, taking into account various ECU debugging methods, Renesas will continue to support new systems, like adding an IDE feature to support Virtual Turnkey which enables software development in the early stage at the same time as actual machine debugging.
