Renesas Electronics Group discloses its consolidated financial statements in accordance with the International Financial Reporting Standards (“IFRS”) starting from the annual securities report for the fiscal year ended December 31, 2018.
Besides, the Group discloses consolidated business results in terms of both its internal measures which the management relies upon in making decisions (“Non-GAAP” financial measures) and those under International Financial Reporting Standards (“IFRS”).
Quarter (IFRS)
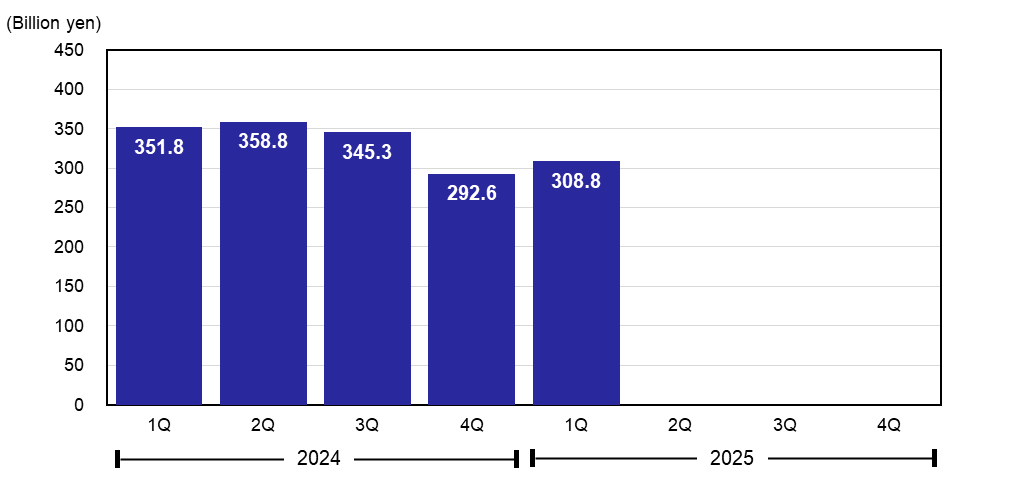
Revenue
Image
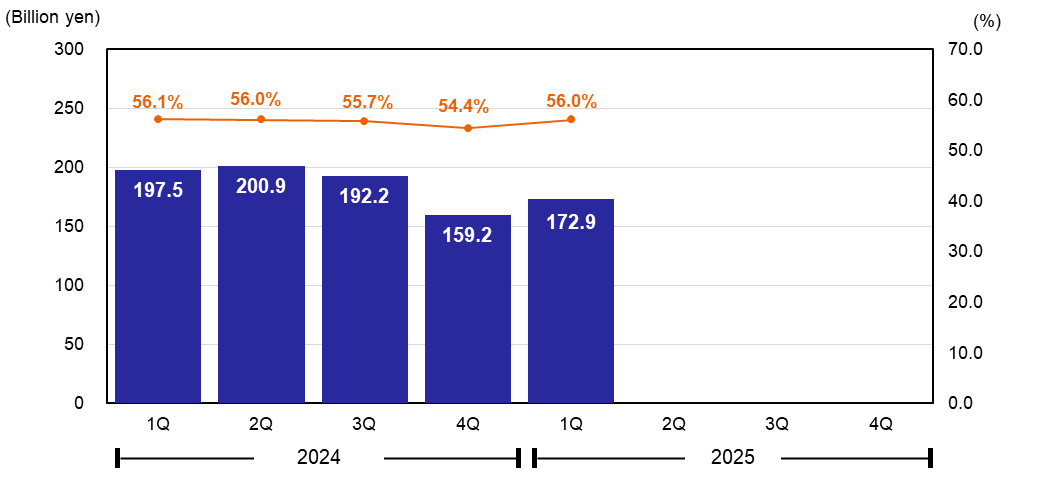
Gross Profit & Gross Margin
Image
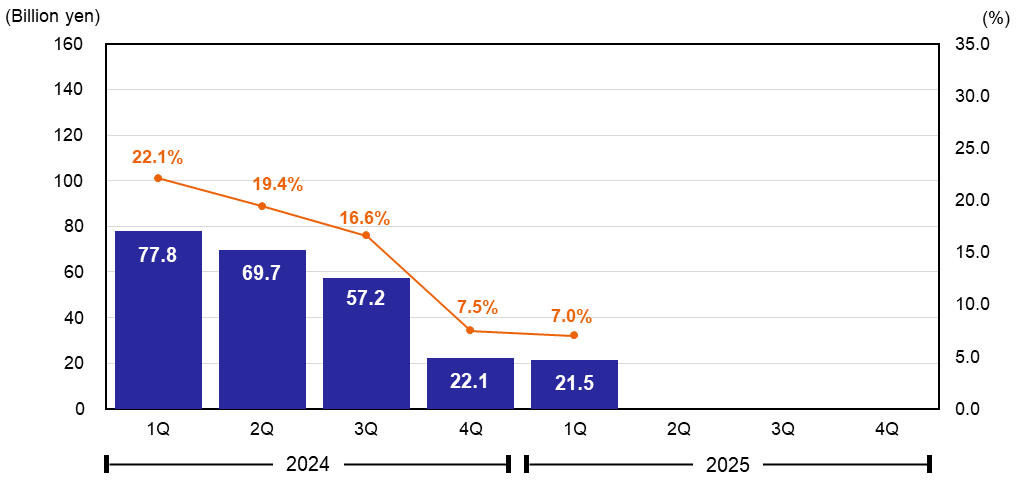
Operating Profit & Operating Margin
Image
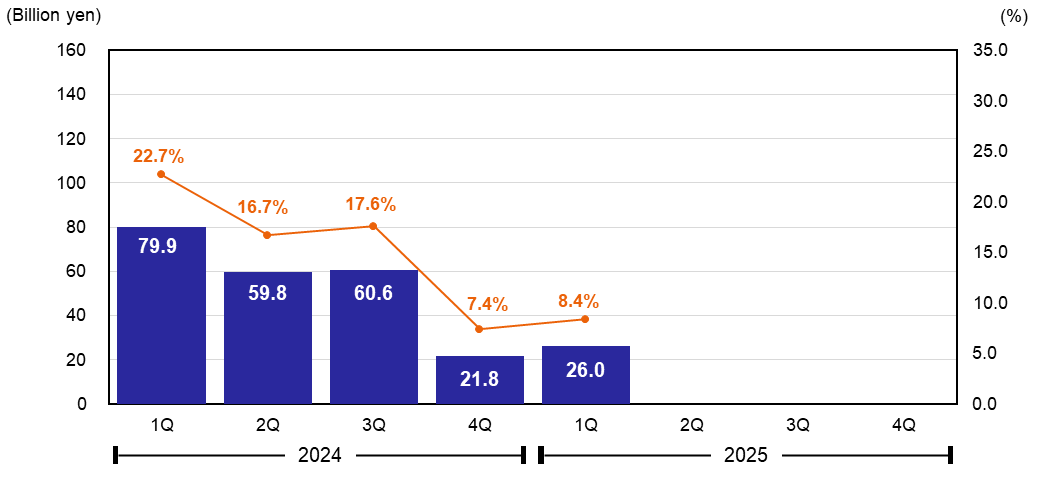
Profit Attributable to Owners of Parent & Net Profit Ratio
Image
2025
(Billion yen)
| 1Q | 2Q | 3Q | 4Q | |
|---|---|---|---|---|
| Revenue | 308.8 | |||
| Gross Profit | 172.9 | |||
| Operating Profit | 21.5 | |||
| Profit Attributable to Owners of Parent | 26.0 |
2024
(Billion yen)
| 1Q | 2Q | 3Q | 4Q | |
|---|---|---|---|---|
| Revenue | 351.8 | 358.8 | 345.3 | 292.6 |
| Gross Profit | 197.5 | 200.9 | 192.2 | 159.2 |
| Operating Profit | 77.8 | 69.7 | 57.2 | 22.1 |
| Profit Attributable to Owners of Parent | 79.9 | 59.8 | 60.6 | 21.8 |
Documentation
Fiscal Year (IFRS)
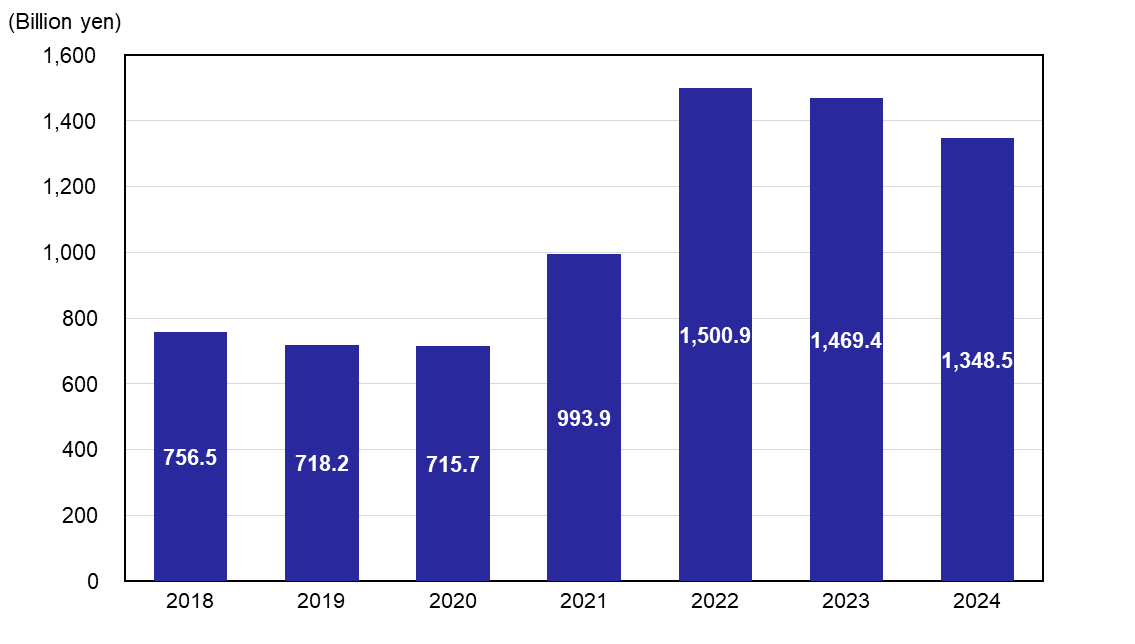
Revenue
Image
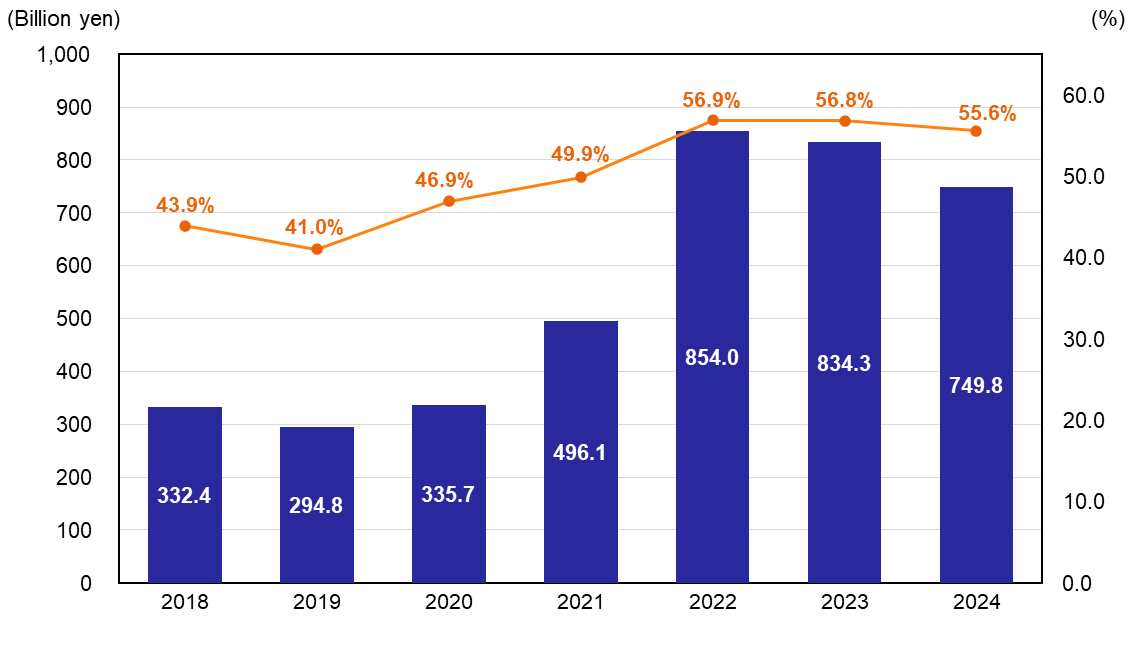
Gross Profit & Gross Margin
Image
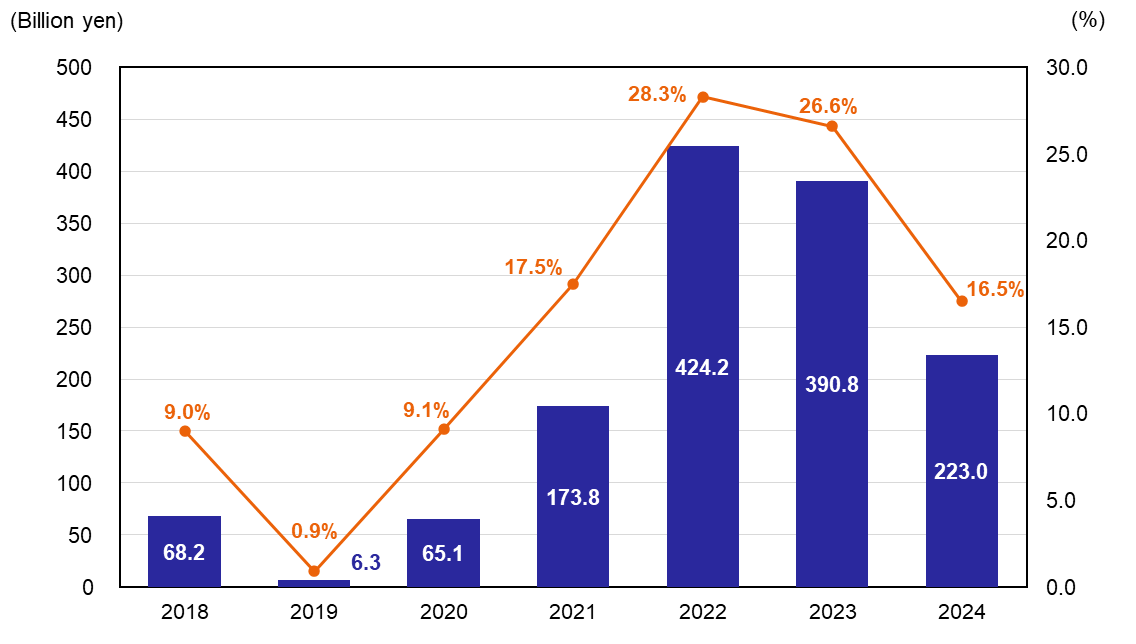
Operating Profit & Sales Operating Loss Ratio
Image
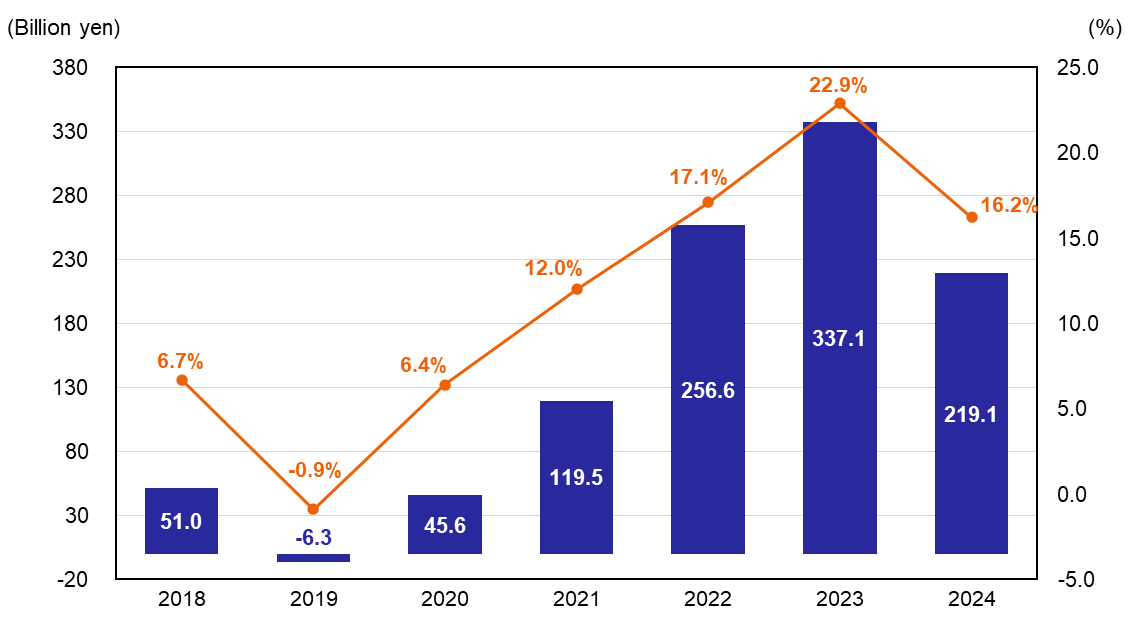
Profit Attributable to Owners of Parent & Net Profit Ratio
Image
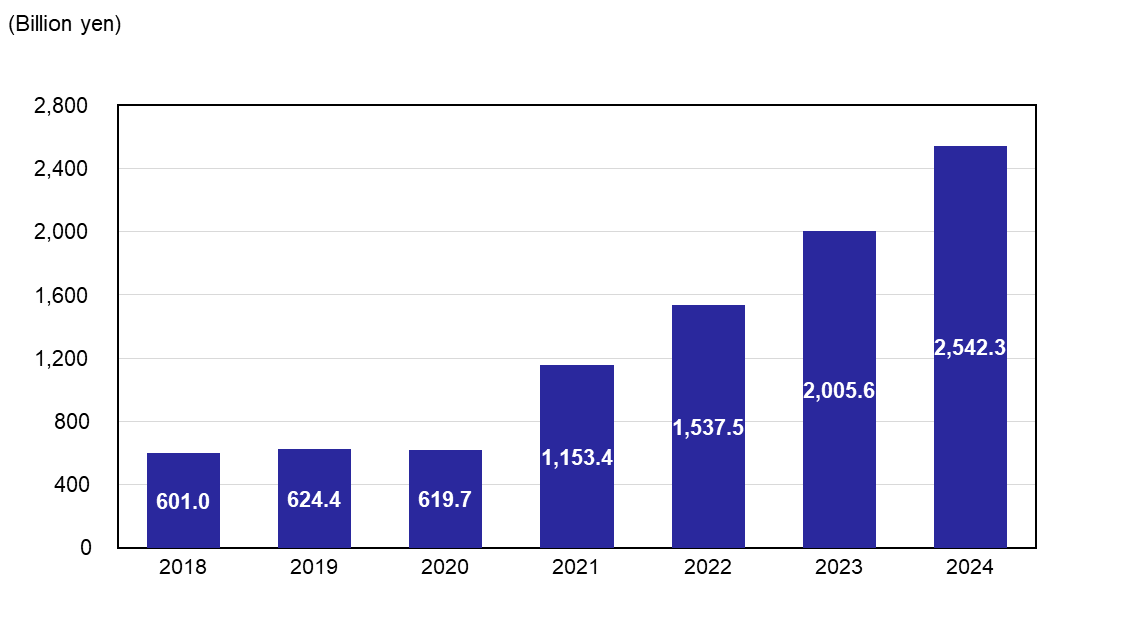
Total equity
Image
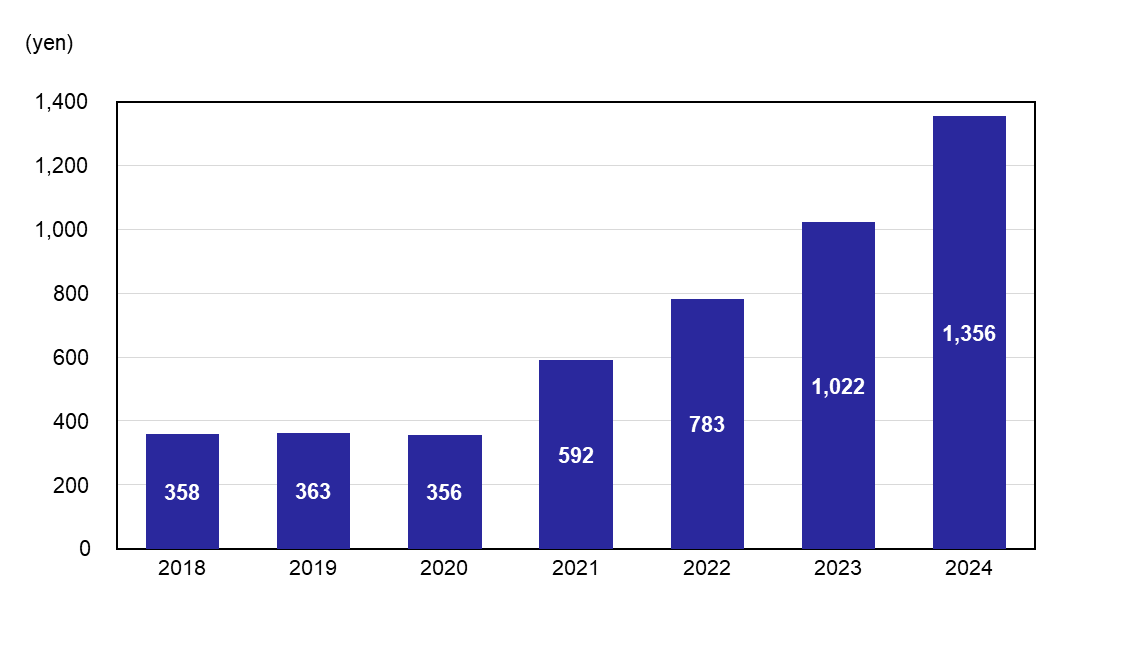
Total equity Per Share (yen)
Image
(Billion yen)
| 2018 | 2019 | 2020 | 2021 | 2022 | 2023 | 2024 | |
|---|---|---|---|---|---|---|---|
| Revenue | 756.5 | 718.2 | 715.7 | 993.9 | 1,500.9 | 1,469.4 | 1,348.5 |
| Gross Profit | 332.4 | 294.8 | 335.7 | 496.1 | 854.0 | 834.3 | 749.8 |
| Operating Profit | 68.2 | 6.3 | 65.1 | 173.8 | 424.2 | 390.8 | 223.0 |
| Profit Attributable to Owners of Parent | 51.0 | (6.3) | 45.6 | 119.5 | 256.6 | 337.1 | 219.1 |
| Total equity | 601.0 | 624.4 | 619.7 | 1,153.4 | 1,537.5 | 2,005.6 | 2,542.3 |
| Total equity Per Share (yen) | 358 | 363 | 356 | 592 | 783 | 1,022 | 1,356 |
Documentation
| Title | Format |
|---|---|
| 7-year Financial Highlights Summary | XLS |