About This Video
Introducing PowerNavigator v5.3.45 and its integration of the latest family of digital power multiphase controllers. In this demonstration, we will be using the ISL68137 7-phase digital multiphase controller.
Resources
Transcript
This video introduces PowerNavigator™ GUI Software and its integration with our latest family of digital power multiphase controllers. PowerNavigator is Renesas' GUI for use of all of our digital power controllers. It's used to configure, set up, read back real time telemetry, and also debug systems on real time.
For today's demonstration, we will be using the ISL68137 7-phase digital multiphase controller. Here we have the evaluation board. It's powered by a 12V and 5V vent supply. We also have PMBus and AVSBus connectors that go to the PC in an alternate interface with our PowerNavigator software.
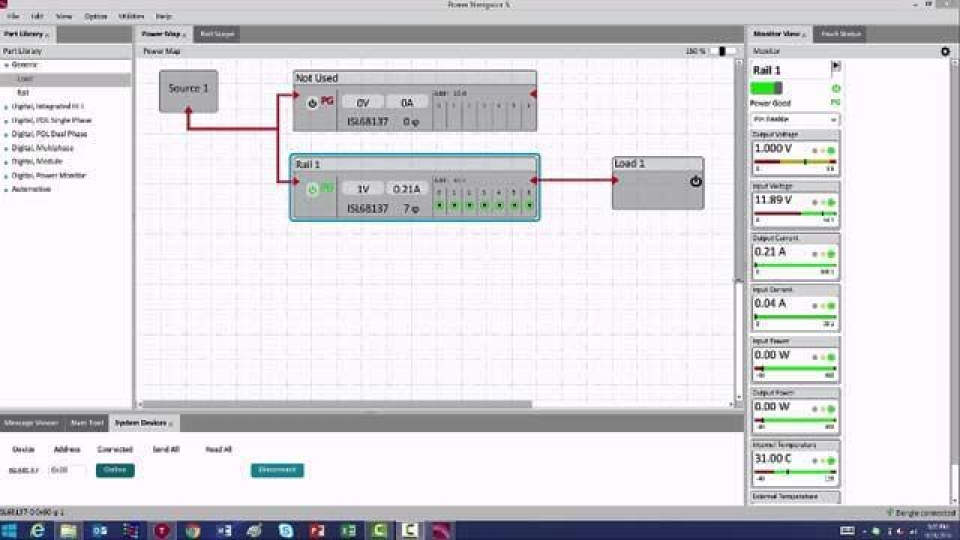
So looking at PowerNavigator, the first thing you'll see is the power map. The power map gives a system-level view of all the products that are connected to the GUI. Here is the ISL68137. It's a dual output device, so we have two blocks on the power map. One block has all seven phases assigned to it. This is highlighted by the seven green dots inside that rail block.
On the right hand side, we have our monitor view. Monitor view shows the output voltage, the input voltage, the load current—all telemetry from the device in real time.
Double-clicking on the rail block brings up the rail inspector design tool. Rail inspector is how we configure the device. It has the rail name, its status, and on the left hand side is a menu. As I walk through the menu, I'm able to fully configure all of the features inside this product.
The first screen we'll look at is called phase configuration. Phase configuration allows me to assign each one of these phases to one of the two control loops inside the device. On this particular board, I have seven phases assigned to loop 1. It also allows us to enable auto-phase dropping for efficiency. When auto-phase dropping is enabled, as the load current changes, we automatically add or take away phases. The thresholds for auto-phase drop are all configured digitally and done so on the screen.
The next page is a general configuration page. This does the outward voltage settings, including the fault limits, as well as the switching frequency.
The power train page is used to set up the power train for this device. You input the MOSFET properties, the inductor that you're using, the output capacitance and its properties.
We also set up a current sense gain. This eval board uses our smart power stage which automatically provides current sense information back to the controller, making current sense very easy to set up.
The next page is the transient setup page. The transient setup page is where you configure the digital control loop inside this device. It's used to set up the control loop gains, AC current feedback, and then additional things like pulse advance and load line settling to improve the low transient response. If you're using R load line, the droop impedance is set in the R droop box.
The next screen is diode braking. Diode braking is used to improve the transient response by turning off the load-side MOSFET during a load release. This can reduce the overshoot of the output voltage, improving the overall response of the controller. Ramp time is used to set the on delays, the off delays, as well as the rise and fall times of the controller.
The final screen here in the general loop configuration is the temperature sense setup. This enables an external diode or the TMON output from the smart power stage, where the controller can measure the real-time temperature of the smart power stage.
Moving on to the faults section, all the faults in this device are configured digitally. So the fault responses and fault thresholds all are configured with this GUI, making the responses in the setup threshold very easy to set. We have voltage, current, and temperature faults. They're all configured with the GUI.
The final thing is a black box. Black box is used to automatically trigger black box capture, in the case of a fault. When enabled and a fault happens, the controller captures all the telemetry information and saves that to the device. This can be used for debug later on and as way to tell exactly why a controller shut down.
Once the device is fully configured, you have the memory configuration page. Inside the device, there are eight different configuration IDs that allow you to save up to eight unique settings inside these controllers. Once you're done configuring, you would simply hit save, and that would save that setting to one of these eight slots inside the device's non-volatile memory.
The real inspector tool also has advanced features like AVSBus. AVSBus is a fast point-to-point communication with up to 50MHz speed. This allows the part to communicate with A6 as support AVSBus interfaces in a very fast manner. With PowerNavigator, you can very quickly evaluate and demonstrate AVSBus and see if the dynamic response behavior of the controller within oscilloscope.
The final page here is the telemetry page. Telemetry allows you to plot real-time telemetry of the device. This includes input voltage, output voltage, current, etc., all plotted in real time, as we've shown here.
We hope this video was helpful in explaining how the PowerNavigator software interfaces with our full digital multiphase controllers.