
Environmental Activities
Environmental Initiatives | Environmental Protection Goals | Climate Change Initiatives | Conserving Water | Waste Reduction Efforts | Chemical Substance Use | Eco-Product Initiatives | Eco-Communication Initiatives | Biodiversity Conservation Activities | Environmental Data and Third-Party Verification
Environmental Data and Third-Party Verification
GHG Emissions | Energy Consumption | Water | Chemical Substances | Waste | Regulatory Violations and Complaints | Environmental Accounting | Third-Party Verification
GHG Emissions
Category1 | Category2 | Unit | Japan | Outside Japan | World Wide | ||||||||||
|---|---|---|---|---|---|---|---|---|---|---|---|---|---|---|---|
| 2021 | 2022 | 2023 | 2021 | 2022 | 2023 | 2021 | 2022 | 2023 | |||||||
| CO2 | Total Emissions (S1+S2) | t-CO2 | 821,562 | 758,433 | 658,883 | 158,277 | 155,251 | 145,180 | 979,839 | 913,684 | 804,063 | ||||
| Emissions | Scope1 | Total Direct Emissions | t-CO2 | 191,336 | 191,543 | 152,805 | 6,780 | 4,719 | 3,598 | 198,116 | 196,261 | 156,403 | |||
| Fuel, etc. | t-CO2 | 41,351 | 38,426 | 35,539 | 367 | 326 | 327 | 41,718 | 38,751 | 35,866 | |||||
| PFC Emissions (IPCC2006 Tier2a) | t-CO2 | 149,985 | 153,117 | 117,266 | 6,413 | 4,393 | 3,271 | 156,398 | 157,510 | 120,537 | |||||
| Scope2 | Indirect Emissions | t-CO2 | 630,226 | 566,890 | 506,077 | 151,497 | 150,532 | 141,582 | 781,723 | 717,422 | 647,660 | ||||
| (ref.) | Purchased Electricity (Market Standards) | t-CO2 | 617,954 | 552,372 | 491,644 | 148,184 | 147,184 | 137,740 | 766,138 | 699,555 | 629,384 | ||||
| Purchased Electricity (Location Standards) | t-CO2 | 541,529 | 526,843 | 507,075 | 192,910 | 192,479 | 178,875 | 734,438 | 719,323 | 685,950 | |||||
| Other than Electricity | t-CO2 | 12,272 | 14,519 | 14,433 | 3,313 | 3,348 | 3,842 | 15,585 | 17,867 | 18,276 | |||||
| Scope3 | Emissions within the Supply Chain Excluding S1 and S2 | t-CO2 | NA | NA | NA | NA | NA | NA | 2,491,090 | 2,093,087 | 1,694,257 | ||||
| C1 | Purchased Goods and Services | t-CO2 | NA | NA | NA | NA | NA | NA | 2,234,587 | 1,842,705 | 1,428,994 | ||||
| C2 | Capital Goods | t-CO2 | NA | NA | NA | NA | NA | NA | 128,920 | 120,942 | 138,738 | ||||
| C3 | Fuel- and Energy-Related Activities (Not Included in Scope 1 or Scope 2) | t-CO2 | NA | NA | NA | NA | NA | NA | 114,649 | 112,074 | 105,895 | ||||
| C4 | Upstream Transportation and Distribution | t-CO2 | NA | NA | NA | NA | NA | NA | 489 | 428 | 404 | ||||
| C5 | Waste Generated by Operations | t-CO2 | NA | NA | NA | NA | NA | NA | 7,042 | 6,843 | 5,205 | ||||
| C6 | Business Travel | t-CO2 | NA | NA | NA | NA | NA | NA | 1,727 | 6,823 | 11,899 | ||||
| C7 | Employee Commuting | t-CO2 | NA | NA | NA | NA | NA | NA | 3,677 | 3,272 | 3,123 | ||||
| C8 | Leased Upstream Assets | t-CO2 | NA | NA | NA | NA | NA | NA | 0 | 0 | 0 | ||||
| C9 | Downstream Transportation and Distribution | t-CO2 | - | - | - | - | - | - | - | - | - | ||||
| C10 | Processing of Sold Products | t-CO2 | - | - | - | - | - | - | - | - | - | ||||
| C11 | Use of Sold Products | t-CO2 | - | - | - | - | - | - | - | - | - | ||||
| C12 | End-of-Life Treatment of Sold Products | t-CO2 | - | - | - | - | - | - | - | - | - | ||||
| C13 | Leased Downstream Assets | t-CO2 | NA | NA | NA | NA | NA | NA | 0 | 0 | 0 | ||||
| C14 | Franchises | t-CO2 | NA | NA | NA | NA | NA | NA | 0 | 0 | 0 | ||||
| C15 | Investments | t-CO2 | NA | NA | NA | NA | NA | NA | 0 | 0 | 0 | ||||
In order to calculate CO2 emission level calculation in relation to electricity, we have used the factor provided by the "List of Calculation Methods/ Emission Factors in the Calculation, Report and Publication System" of the Ministry of the Environment and the Ministry of Economy, Trade and Industry of Japan, adjusted conversion factors for individual power businesses based on the Act on Promotion of Global Warming Countermeasures. For figures that represent outside of Japan, the latest values for the each fiscal year supplied by power supply companies. When the CO2 emission levels are uncertain, we use the conversion factors of previous year. For the CO2 emission factor for gas and fuel at the time of calculation, we used the factor provided by the "List of Calculation Methods/ Emission Factors in the Calculation, Report and Publication System" of the Ministry of the Environment and the Ministry of Economy, Trade and Industry of Japan.
Energy Consumption
Category1 | Category2 | Unit | Japan | Outside Japan | World Wide | |||||||||
|---|---|---|---|---|---|---|---|---|---|---|---|---|---|---|
| 2021 | 2022 | 2023 | 2021 | 2022 | 2023 | 2021 | 2022 | 2023 | ||||||
| Total Energy | ㎿h | 1,512,651 | 1,493,746 | 1,460,039 | 290,219 | 287,846 | 275,611 | 1,802,870 | 1,781,592 | 1,735,649 | ||||
| Electricity | ㎿h | 1,253,539 | 1,240,642 | 1,225,663 | 271,455 | 269,270 | 255,942 | 1,524,994 | 1,509,912 | 1,481,605 | ||||
| (Include) Renewable Energy | ㎿h | 0 | 13,584 | 68,544 | 733 | 1,305 | 3,818 | 733 | 14,890 | 72,362 | ||||
| Steam | ㎿h | 57,949 | 68,561 | 62,530 | 16,940 | 16,887 | 18,004 | 74,889 | 85,449 | 80,534 | ||||
| Gas | ㎿h | 146,001 | 129,425 | 133,329 | 1,572 | 1,678 | 1,654 | 147,574 | 131,102 | 134,982 | ||||
| Other Fuels | ㎿h | 55,161 | 55,118 | 38,517 | 251 | 11 | 11 | 55,413 | 55,129 | 38,528 | ||||
| Factory | ㎿h | 1,511,900 | 1,492,987 | 1,459,367 | 290,219 | 287,846 | 275,611 | 1,802,118 | 1,780,833 | 1,734,978 | ||||
| Electricity | ㎿h | 1,252,788 | 1,239,883 | 1,224,997 | 271,455 | 269,270 | 255,942 | 1,524,243 | 1,509,153 | 1,480,940 | ||||
| (Include) Renewable Energy | ㎿h | 0 | 13,134 | 67,957 | 733 | 1,305 | 3,818 | 733 | 14,439 | 71,775 | ||||
| Steam | ㎿h | 57,949 | 68,561 | 62,530 | 16,940 | 16,887 | 18,004 | 74,889 | 85,448 | 80,534 | ||||
| Gas | ㎿h | 146,001 | 129,425 | 133,322 | 1,572 | 1,678 | 1,654 | 147,574 | 131,103 | 134,976 | ||||
| Other fuels | ㎿h | 55,161 | 55,118 | 38,517 | 251 | 11 | 11 | 55,413 | 55,129 | 38,528 | ||||
| Office | ㎿h | 751 | 760 | 672 | - | - | - | 751 | 760 | 672 | ||||
| Electricity | ㎿h | 751 | 760 | 665 | - | - | - | 751 | 760 | 665 | ||||
| (Include) Renewable Energy | ㎿h | 0 | 451 | 587 | - | - | - | 0 | 451 | 587 | ||||
| Steam | ㎿h | 0 | 0 | 0 | - | - | - | 0 | 0 | 0 | ||||
| Gas | ㎿h | 0 | 0 | 6 | - | - | - | 0 | 0 | 6 | ||||
| Other fuels | ㎿h | 0 | 0 | 0 | - | - | - | 0 | 0 | 0 | ||||
| Energy Consumption per Revenue | Consolidated Revenue | Oku yen | - | - | - | - | - | - | 9,944 | 15,027 | 14,697 | |||
| per Revenue | ㎿h/ Oku yen | - | - | - | - | - | - | 181 | 119 | 118 | ||||
Water
Category1 | Category2 | Unit | Japan | Outside Japan | World Wide | |||||||||
|---|---|---|---|---|---|---|---|---|---|---|---|---|---|---|
| 2021 | 2022 | 2023 | 2021 | 2022 | 2023 | 2021 | 2022 | 2023 | ||||||
| Total Amount Used (Water Intake + Recycled Water) | Km3 | 22,771 | 21,406 | 21,630 | 2,096 | 1,997 | 1,941 | 24,867 | 23,403 | 23,571 | ||||
| Total Water Withdrawal by Source | Km3 | 14,222 | 13,870 | 13,862 | 1,899 | 1,936 | 1,880 | 16,121 | 15,806 | 15,742 | ||||
| Surface Water (Rivers, Lakes, Ponds) | Km3 | 9,140 | 8,865 | 8,678 | 391 | 477 | 385 | 9,531 | 9,342 | 9,063 | ||||
| Ground Water (Wells, Boreholes) | Km3 | 4,580 | 4,656 | 4,644 | 0 | 0 | 0 | 4,580 | 4,656 | 4,644 | ||||
| Municipal Water (Tap Water) | Km3 | 502 | 349 | 540 | 1,508 | 1,459 | 1,495 | 2,010 | 1,808 | 2,035 | ||||
| Ocean Water | Km3 | 0 | 0 | 0 | 0 | 0 | 0 | 0 | 0 | 0 | ||||
| Others (Rain Water, Quarries, External Effluents) | Km3 | 0 | 0 | 0 | 0 | 0 | 0 | 0 | 0 | 0 | ||||
| Recycled Water | Km3 | 8,549 | 7,536 | 7,769 | 197 | 61 | 60 | 8,746 | 7,597 | 7,829 | ||||
| Water Recycled and Reused | % | 38 | 35 | 36 | 9 | 3 | 3 | 35 | 32 | 33 | ||||
| Total Water Discharge | Km3 | 11,933 | 11,513 | 10,786 | 1,142 | 1,176 | 1,213 | 13,075 | 12,689 | 11,999 | ||||
| * There are no discharge made to the ground surface | Public Water (Ocean) | Km3 | 11,349 | 10,952 | 10,191 | 372 | 374 | 365 | 11,721 | 11,326 | 10,556 | |||
| Sewerage (Off-Site Water Treatment) | Km3 | 584 | 561 | 595 | 434 | 462 | 494 | 1,018 | 1,022 | 1,088 | ||||
| Others (Underground, Wells) | Km3 | 0 | 0 | 0 | 336 | 341 | 354 | 336 | 341 | 354 | ||||
| Water Use per Revenue | Consolidated Revenue | Oku yen | - | - | - | - | - | - | 9,944 | 15,027 | 14,697 | |||
| per Revenue | Km3 /Oku yen | - | - | - | - | - | - | 2.5 | 1.6 | 1.6 | ||||
Water data: Data from all Renesas Group manufacturing sites (excluding domestic and overseas sales offices)
Chemical Substances
Category1 | Category2 | Unit | Japan | Outside Japan | World Wide | |||||||||
|---|---|---|---|---|---|---|---|---|---|---|---|---|---|---|
| 2021 | 2022 | 2023 | 2021 | 2022 | 2023 | 2021 | 2022 | 2023 | ||||||
| Chemical Substances (subject to PRTR Law) | Transaction Volume | t | 1,484 | 1,353 | 1,112 | 28 | 18 | 17 | 1,512 | 1,371 | 1,129 | |||
| VOC | Emissions (Atmosphere) | t | 357 | 367 | 311 | - | - | - | 357 | 367 | 311 | |||
Waste
Category1 | Category2 | Unit | Japan | Outside Japan | World Wide | |||||||||
|---|---|---|---|---|---|---|---|---|---|---|---|---|---|---|
| 2021 | 2022 | 2023 | 2021 | 2022 | 2023 | 2021 | 2022 | 2023 | ||||||
| Total Waste | t | 17,042 | 16,787 | 13,369 | 3,849 | 3,950 | 3,877 | 20,891 | 20,737 | 17,246 | ||||
| Total Hazardous Waste | t | 2,596 | 2,085 | 1,307 | 1,534 | 1,561 | 1,296 | 4,130 | 3,646 | 2,603 | ||||
| Recycling | t | 2,338 | 1,830 | 1,307 | 706 | 687 | 642 | 3,044 | 2,517 | 1,949 | ||||
| Landfill | t | 4 | 3 | 0 | 737 | 779 | 543 | 741 | 782 | 543 | ||||
| Others (Intermediate processes, etc.) | t | 254 | 252 | 0 | 91 | 95 | 111 | 345 | 347 | 111 | ||||
| Total Non Hazardous Waste | t | 14,446 | 14,702 | 12,062 | 2,315 | 2,389 | 2,581 | 16,761 | 17,091 | 14,643 | ||||
| Recycling | t | 14,108 | 14,228 | 10,957 | 1,446 | 1,467 | 1,414 | 15,554 | 15,695 | 12,371 | ||||
| Landfill | t | 17 | 10 | 19 | 868 | 922 | 1,167 | 885 | 932 | 1,186 | ||||
| Others (Intermediate processes, etc.) | t | 321 | 464 | 1,086 | 1 | 0 | 0 | 322 | 464 | 1,086 | ||||
2021 Domestic results: We have reconsidered the classification of waste treatment that causes partial landfill from recycling to other (intermediate treatment, etc.). The breakdown of domestic results for 2019/2020 (recycling <-> intermediate processing, etc.) will be reviewed in the same way. The total amount of waste remains unchanged.
Regulatory Violations and Complaints
Category1 | Category2 | Unit | Japan | Outside Japan | World Wide | |||||||||
|---|---|---|---|---|---|---|---|---|---|---|---|---|---|---|
| 2021 | 2022 | 2023 | 2021 | 2022 | 2023 | 2021 | 2022 | 2023 | ||||||
| Regulatory Violations | case | 0 | 0 | 0 | 0 | 0 | 0 | 0 | 0 | 0 | ||||
| (Include) Water discharge Related | case | 0 | 0 | 0 | 0 | 0 | 0 | 0 | 0 | 0 | ||||
| Complaints | case | 0 | 0 | 0 | 0 | 0 | 0 | 0 | 0 | 0 | ||||
| (Include) Water discharge Related | case | 0 | 0 | 0 | 0 | 0 | 0 | 0 | 0 | 0 | ||||
Environmental Accounting
* Unit: Millions of yen
| Item | Contents | 2021 | 2022 | 2023 | ||||||||||
| Environmental protection costs | Effect | Environmental protection costs | Effect | Environmental protection costs | Effect | |||||||||
| Investment amount * | Expense amount* | Economic benefits* | Environ- mental impact reduction | Investment amount * | Expense amount * | Economic benefits * | Environ- mental impact reduction | Investment amount * | Expense amount * | Economic benefits * | Environ- mental impact reduction | |||
| Business area | Pollution prevention | Pollution prevention (air, water, etc.) | 323 | 1,917 | 42 | Energy reduction 131.2GWh | 1,333 | 2,356 | 42 | Energy reduction 37.8GWh | 1180 | 2926 | 49 | Energy reduction 70Wh |
| Global environmental protection | Energy-saving measures, global warming prevention, etc. | 726 | 1,336 | 1,271 | 1,025 | 983 | 921 | 950 | 1003 | 887 | ||||
| Resource circulation | Efficient use of resources through waste reduction, water conservation, recycling, etc. | 0 | 613 | 857 | 0 | 581 | 762 | 42 | 480 | 817 | ||||
| Upstream/ downstream | Green procurement, product assessment, collection and recycling of packaging materials, etc. | 0 | 2 | - | 0 | 0 | - | 0 | 0 | - | ||||
| Management activities | Maintenance and operation of environmental management, education, etc. | 0 | 326 | - | 0 | 281 | - | 0 | 261 | - | ||||
| Research and Development | R&D to reduce the environmental impact of products and manufacturing processes | 0 | 5 | - | 0 | 5 | - | 0 | 8 | - | ||||
| Social Activities | Donations and support for local volunteer activities, environmental preservation organizations, etc. | 0 | 7 | - | 0 | 13 | - | 0 | 12 | - | ||||
| Environmental damage | Remediation of soil and groundwater contamination, compensation related to environmental conservation, etc. | 0 | 27 | - | 9 | 8 | - | 0 | 4 | - | ||||
| Total | 1,050 | 4,233 | 2,170 | 2,367 | 4,228 | 1,725 | 2,171 | 4,693 | 1,753 | |||||
Third-Party Verification
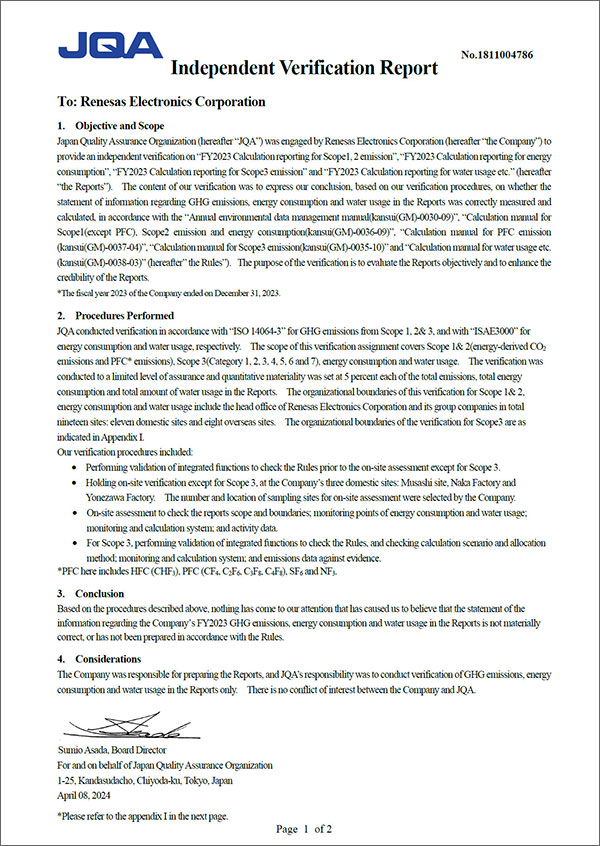
Renesas Group receives third-party verification by Japan Quality Assurance Organization (JQA) in order to ensure the reliability of Environmental data.
2023 JQA Independent Verification Report
2022 JQA Independent Verification Report
The greenhouse gas (GHG) emissions for the fiscal year 2022 were calculated using the emission factors announced on January 24, 2023 for the fiscal year 2021. These calculations have been verified by a third-party verification from JQA. The impact – regarding the correction measures for miscalculations in the emission factors for year of 2021, resulting from the miscalculation of the emission factors for the fiscal year 2021 (METI) of this time, qualifies as a subsequent event. Nevertheless, since it falls below the quantitative materiality threshold (Confirmed by the verification agency), our company has not conducted any additional third-party verification.
Environmental Activities
Environmental Initiatives | Environmental Protection Goals | Climate Change Initiatives | Conserving Water | Waste Reduction Efforts | Chemical Substance Use | Eco-Product Initiatives | Eco-Communication Initiatives | Biodiversity Conservation Activities | Environmental Data and Third-Party Verification