Jump to Page Section:
Overview
Description
This product is a simulator debugger which allows you to run and evaluate your application program without any target hardware on Renesas integrated development environment "High-performance Embedded Workshop". It provides a source-level-debugging environment with abundant break features and advanced functions such as coverage measurement and virtual interrupts. In addition, its user friendly interface and multi-window (overlappable) will offer stress-free debugging environment.
This product is a component of the compiler package and assembler package. Installing one of the above packages allows you to debug using this simulator debugger under a High-performance Embedded Workshop environment (Renesas IDE).
Features
- I/O script function (peripheral I/O simulation such as a timer)
- Interrupt simulation function
- Programming a target system using the GUI Input Window and GUI Output Window for simple targetless debugging
- Comfortable debugging environment provided by drag & drop operation
- C language and assembly language source level debugging and many other basic debug features
- RAM monitoring
- On-line help in HTML
- Learn More
Release Information
Target Devices
Additional Details
Functions
[Basic Functions]
| Functions | Description |
|---|---|
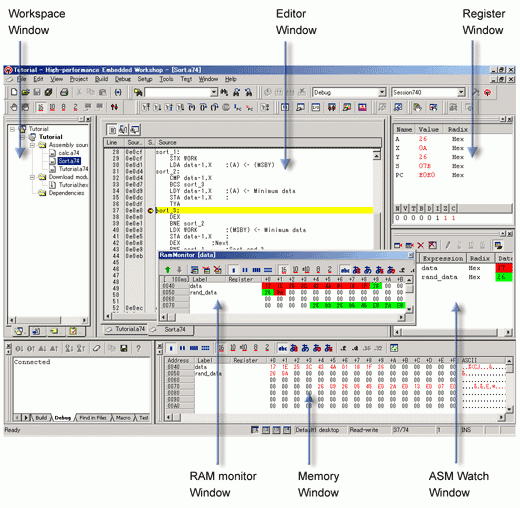
| Register Window | Displays/changes content of flags and registers particular to the MCU. |
| Memory Window | Displays memory content together with the address and label. Display format can be selected from among binary, decimal, hexadecimal, ASCII, SJIS (for Japanese) or JIS (for Japanese) . |
| RAM Monitor Window | Displays memory content changed during target program execution. The area read during program execution is displayed in green, and the area written is displayed in red. (You can set colors of your choice.) |
| ASM Watch Window | Monitors changes in memory content and variable content declared on the assembly language level. Display format can be selected from among binary, decimal, and hexadecimal. If the specified address is within the real-time RAM area, the area read is displayed in green, and the area written is displayed in red. (You can set colors of your choice.) |
| C Watch Window | Displays C variable contents. In addition to a window that displays variable formula of your choice, there are windows that display external variables, local variables within a file, and local variables within a function. |
| Script Window | Window for executing commands from the keyboard or script files. An area is provided for displaying command execution results and command history. Execution results can be output to a file. |
| S/W Break Point Setting Window | Enables set / cancel the software break points. You can set up to 64 break points (OR condition). |
| H/W Break Point Setting Dialog | Enables set / cancel the hardware break points. You can set up to 64 break points (OR condition). |
[Advanced Functions]
| Functions | Description |
|---|---|
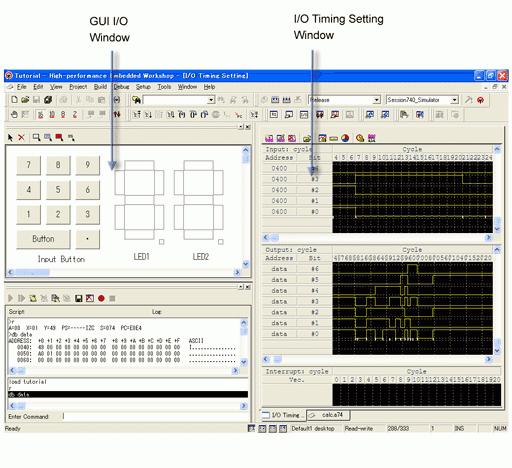
| I/O Timing Setting Window | Inputs/outputs to a port, and sets/displays interrupts. It is also possible to check cycle-by-cycle data input, definition of interrupt, and change of output data. And, a timer interrupt occurrence at time intervals in units of msec/µsec is enabled. (Note that the CPU operating frequency need to be specified.) Besides, there is the I/O script function that can simulate peripheral I/O (timer, analog to digital converter, etc.) operation. By registering I/O script of peripheral I/O (written in script format in a file) in the I/O window, you can simulate operation of that device. For example, to simulate timer operation, register the following script with "while" and "if": [I/O script defining example of timer operation]
	{
	 	while(1){
			; Down count of Counter
				waitc [0x0020] + 1
			; Occur timer interrupt
				int FFEE
		}
	}
|
| GUI I/O Window | Window for creating key input panels or output panels for the user target system by simple mouse operation. [Input panel]: You can define operation of data input or interrupt for the created keys. Pressing the key while the program is running generates data input or interrupt. [Output panel]: You can display by LED or label according to the value of the output data. |
| Coverage Window | Shows coverage measurement results of C language functions. Start/end addresses and coverage can be checked. Double-clicking the line to be checked opens a coverage source window to show executed/unexecuted in a line of source. |
Specifications
| Functions | Description |
|---|---|
| I/O simulation | Data can be input/output cycle-by-cycle. |
| Interrupt simulation | Interrupt occurrence in units of cycles or time (msec/µsec) is enabled. |
| Execution time measurement | Execution time is worked out by the CPU operating frequency and the number of CPU execution cycles. (Note1) |
| RAM monitor display | Any 1K byte of memory is displayable. |
| Coverage measurement | Coverage of all memory area can be measured. |
Note
- This simulator debugger is an instruction set simulator and does not include bus width, queue, or wait events when counting the number of cycles. Rather, it uses the values indicated in the microcomputer software manual for the number of cycles.

