Jump to Page Section:
Overview
Description
The M3T-PD32RSIM simulator debugger for the M32R microcontroller family allows you to run and evaluate your application program without any target hardware. It provides a source-level-debugging environment with abundant break features and advanced functions such as coverage measurement and virtual interrupts. In addition, its user friendly and multi-window (overlappable) interface offers a stress-free debugging environment.
This debugger also allows you to customize with a programming tool such as Microsoft Visual C++ or Visual Basic (the PDSDK COM kit required). For example, you can create a user-defined window and interface between the debugger and other COM-compliant applications.
Features
- Real-time OS debugging
- I/O script function (peripheral I/O simulation such as a timer)
- Programming a target system using the GUI Input Window and GUI Output Window for simple targetless debugging
- Comfortable debugging environment provided by drag & drop operation
- C language and assembly language source level debugging and many other basic debug features
- RAM monitoring
- Creating user-defined windows and commands
- On-line help in HTML
- Learn More
Release Information
Target Devices
Downloads
|
|
|
|
|---|---|---|
| Type | Title | Date |
| Software & Tools - Evaluation Software | EXE 7.96 MB 日本語 | |
| Upgrade - Debugger | EXE 7.96 MB 日本語 | |
| Software & Tools - Other | EXE 3.14 MB 日本語 | |
| Software & Tools - Other | EXE 1.81 MB 日本語 | |
4 items
|
||
Additional Details
Functions
Basic Functions
| Functions | Description |
|---|---|
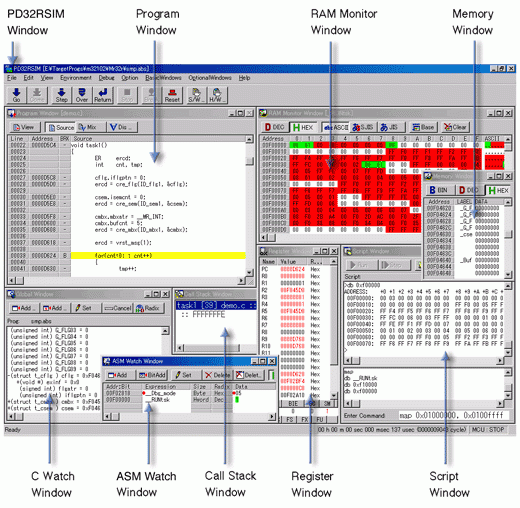
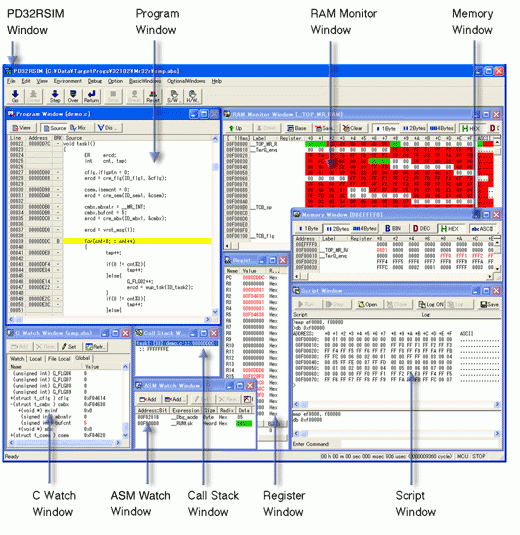
| PD32RSIM Window | Controls entire debugger. You can perform the following basic debugging commands by using the tool bar buttons: program execution/stop, step execution, execution up to cursor position, and break point setting/clearing. You can also open various other windows from this window. |
| Program Window | Displays the program. Source code is editable here. Matching address line is displayed in color for the program counter (PC). You can select display format from among "source", "disassemble" or "mixed". You can also set or cancel break points. |
| Source Window | Displays the designated place of a program. Source code is editable here. Unlike the program window, you can open more than one window. The window is displayed continuing a certain function or task, and is convenient when break points have to be set and canceled repeatedly. |
| Register Window | Displays/changes content of flags and registers particular to the MCU. |
| Memory Window | Displays memory content together with the address and label. Display format can be selected from among binary, decimal, hexadecimal, ASCII, SJIS (for Japanese) or JIS (for Japanese) . |
| Dump Window | Displays memory content in dump format. Display format can be selected from among decimal, hexadecimal, ASCII, SJIS (for Japanese) or JIS (for Japanese) . |
| RAM Monitor Window | Displays memory content changed during target program execution. The area read during program execution is displayed in green, and the area written is displayed in red. (You can set colors of your choice.) |
| ASM Watch Window | Monitors changes in memory content and variable content declared on the assembly language level. Display format can be selected from among binary, decimal, and hexadecimal. If the specified address is within the real-time RAM area, the area read is displayed in green, and the area written is displayed in red. (You can set colors of your choice.) |
| C Watch Window | Displays C variable content. In addition to a window that displays variable formula of your choice, there are windows that display external variables, local variables within a file, and local variables within a function. |
| Call Stack Window | Displays function call information of C language. |
| Script Window | Window for executing commands from the keyboard or script files. An area is provided for displaying command execution results and command history. Execution results can be output to a file. |
| S/W break point setting dialog | Dialog box for setting/canceling software break points. You can set up to 64 break points (OR condition). |
| H/W break point setting dialog | Dialog box for setting/canceling hardware break points. You can set up to 64 break points (OR condition). |
Advanced Functions
| Functions | Description |
|---|---|
| I/O Window | Inputs/outputs to a port, and sets/displays interrupts. It is also possible to check cycle-by-cycle data input, definition of interrupt, and change of output data. There is the I/O script function that can simulate peripheral I/O (timer, analog to digital converter, etc.) operation. By registering I/O script of peripheral I/O (written in script format in file) in the I/O window, you can simulate operation of that device. |
| GUI Input Window | The window for creating key input panels of user target system by simple mouse operation. You can define operation of data input or interrupt for the keys created. Pressing the key while the program is running generates data input or interrupt. |
| GUI Output Window | The window for creating output panels of user target system by simple mouse operation. You can display by LED or label according to value of output data. |
| Trace Point Setting Window | Sets/cancels trace points. Can set 6 trace points maximum and specifies the combination condition of trace events. For starting and stopping events for tracing, either memory access (read/write) or instruction execution is specifiable. As a combination condition, there are AND and OR. |
| Trace Window | Displays the results of real-time tracing in the emulator. The following three display modes are supported: Bus mode, Disassemble mode and Source mode. Those modes can be used concurrently. |
| Data Trace Window | Graphically shows the data access information on the results of real-time tracing. |
| MR Window | Shows the state of the real-time OS M3T-MR32R. |
| MR Trace Window | Graphically shows task execution histories of programs using the real-time OS M3T-MR32R. Also, each history of interrupt handling, task state transition and system call issuing is shown together. |
| MR Analyze Window | Shows the results of statistical processing of measured data in the range specified with the MR trace window. And shows the list of the following records : the occupation status per interrupt handler or task, history of system call issuing. |
| Task Trace Window | Graphically shows task execution histories of programs using real-time OS. |
| Task Analyze Window | Shows the results of statistical processing of measured data within the range specified with the Task Trace Window. This window shows the occupancies of tasks in a CPU. |
| Coverage Window | Shows coverage measurement results of C language functions. Start/end addresses and coverage can be checked. Double-clicking the line to be checked opens a coverage source window to show executed/unexecuted in a line of source. |
| Custom Window | User-developed new window (called "Custom window") that can be used by registering in the debugger. After registering, "Custom window" can be opened from the menu just like other windows. |
Specifications
| Functions | Description |
|---|---|
| I/O simulation | Data can be input/output cycle-by-cycle. |
| Interrupt simulation | Interrupt occurrence in units of cycles or time (msec/µsec) is enabled. |
| Execution time measurement | Execution time is worked out by the CPU operating frequency and the number of CPU execution cycles. (Note1) |
| Tracing feature | Trace logging up to 256K cycles is possible. |
| RAM monitor display | Any 1K byte of memory is displayable. |
| Coverage measurement | Coverage of all memory area can be measured. |
Note
- This simulator debugger is an instruction set simulator and does not include bus width, queue, or wait events when counting the number of cycles. Rather, it uses the values indicated in the microcomputer software manual for the number of cycles.

